
Figure 3.
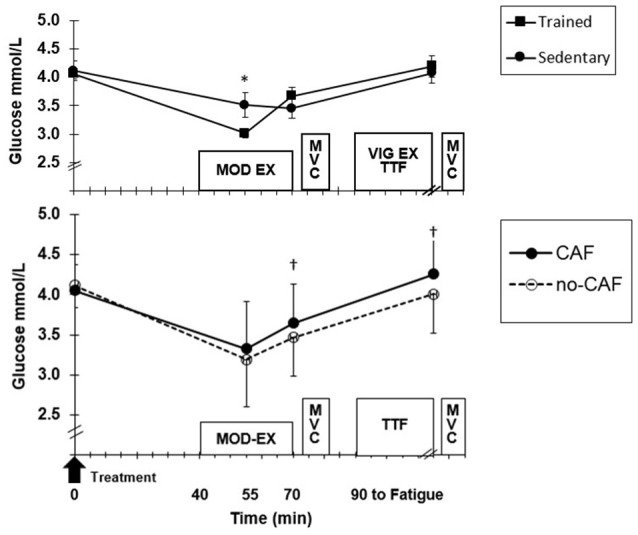
(Top) Mean (±SD) glucose at baseline, moderate exercise (EX) and after time to fatigue (TTF) across treatments for trained and sedentary groups. *Higher (p < 0.05) for sedentary. (Bottom) Treatment effect for all participants. †Higher (p < 0.05) for CAF compared to no-CAF.