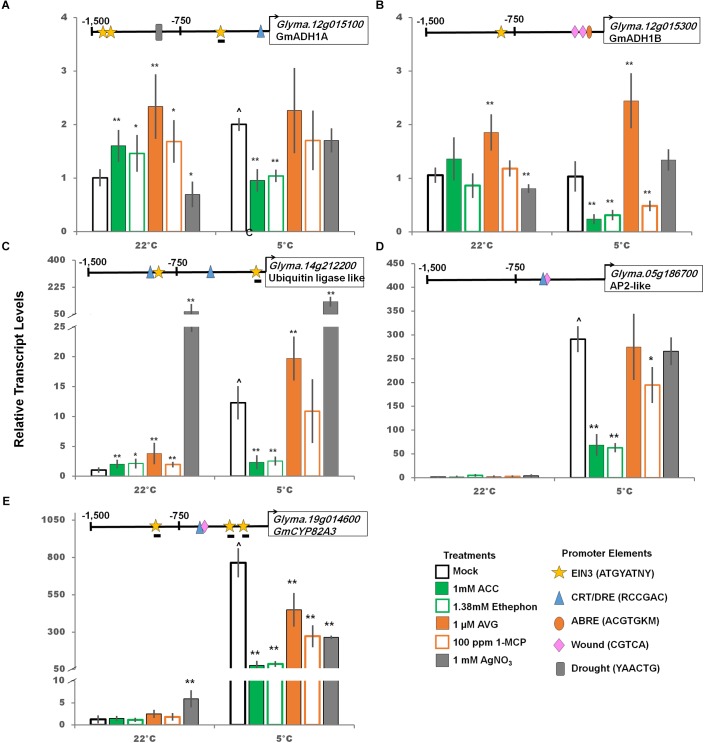
FIGURE 6.
Impact of ethylene pathway stimulation and inhibition on transcript levels of cold responsive genes (panels A-E, GmADH1A, GmADH1B, ubiquitin ligase-like, AP2-like, and GmCYP82A3; respectively) after 2 days at either control or cold temperatures measured via qRT-PCR and normalized to GmUNK1. All promoters depicted in Figure 4–6 were examined for the consensus transcription factor binding elements shown. Binding elements present in promoters displayed above the graph of each transcript. A line beneath the motif symbol indicate the motif is found on the reverse strand. Error bars represent SD. One way ANOVA was performed for each temperature individually (Supplementary Table S3). Post-hoc analysis using TukeyHSD was performed comparing treatment with the mock from the same temperature, ∗p < 0.05, ∗∗p < 0.01. Comparison between cold treated and non-cold treated mocks was done using Student’s t-test, ∧p < 0.05. n = 3 composed of a total of 18–21 plants.

