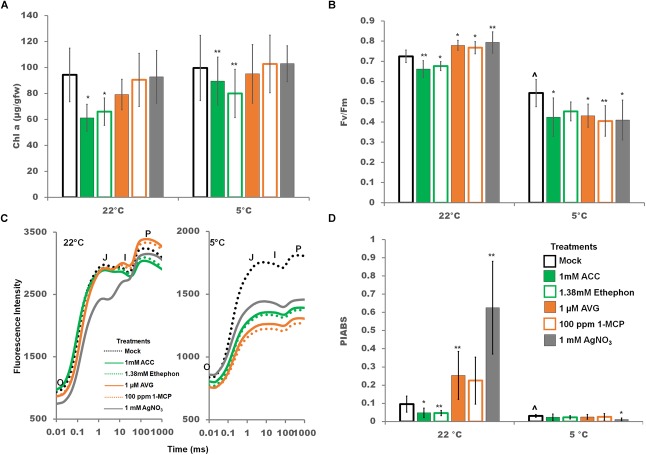
FIGURE 8.
Effects of ethylene pathway manipulation on chlorophyll a content and PSII chlorophyll fluorescence parameters. (A) Chlorophyll a content after 2 days of either control or cold temperatures combined with foliar sprays. (B) Quantum yield of photosystem II (Fv/Fm) after 2 days of either control or cold temperatures combined with foliar sprays. (C) Transient chlorophyll fluorescence (Kautsky curve) plotted on a logarithmic time axis after 2 days of either control or cold temperatures combined with foliar sprays. Averages are represented without error bars for clarity of the graph. (D) The Performance Index (PIABS) is a parameter indicating the functionality and capacity of energy capture from PSII through to reduction of PSI. Error bars represent SD. One way ANOVA was performed for each temperature individually (Supplementary Table S3). Post-hoc analysis using TukeyHSD was performed comparing treatment with the mock from the same temperature, ∗p < 0.05, ∗∗p < 0.01. Comparison between cold treated and non-cold treated mocks was done using Student’s t-test, ∧p < 0.05. n = 9.

