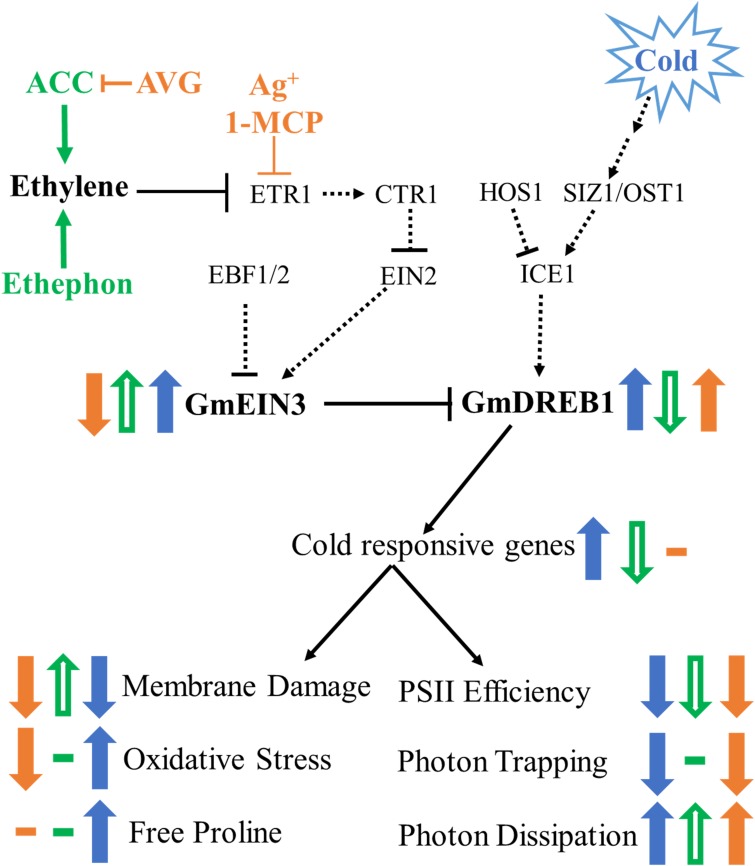
FIGURE 9.
Model of cold stress and ethylene signaling pathway in soybean seedlings. Dashed lines indicated predicted interactions based on Arabidopsis models, solid lines indicate parameters measured in this study. Changes indicated by cold are solid blue arrows, additional changes in the cold due to ethylene pathway stimulation are open green arrows, and ethylene pathway inhibition in solid orange arrows.

