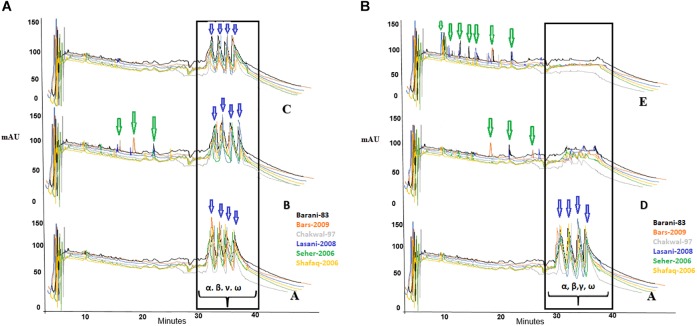
FIGURE 3.
(A) A denotes control sample and the peaks shows no degradation of gliadin fractions; B denotes the fermentation of wheat flours with W. anomalus QAUWA03; C denotes the fermentation of wheat flours with S. cerevisiae fermentation. Different colors express the various wheat varieties. Arrows indicates formation of peptides and amino acids. No substantial degradation was observed in these samples. In this graph α, β, γ, and ω denotes the types of gliadin in wheat varieties. (B) A denotes control sample and the peaks shows no degradation of gliadin fractions; D denotes the fermentation of wheat flours with E. mundtii QAUSD01; E denotes the fermentation of wheat flours with W. anomalus QAUWA03 and E. mundtii QAUSD01 consortia. Maximum gliadin degradation was observed in consortia fermented wheat flours. Arrows indicates formation of peptides (<33 mer) and amino acids. Different colors express the various wheat varieties. In this graph α, β, γ, and ω denotes the types of gliadin in wheat varieties.

