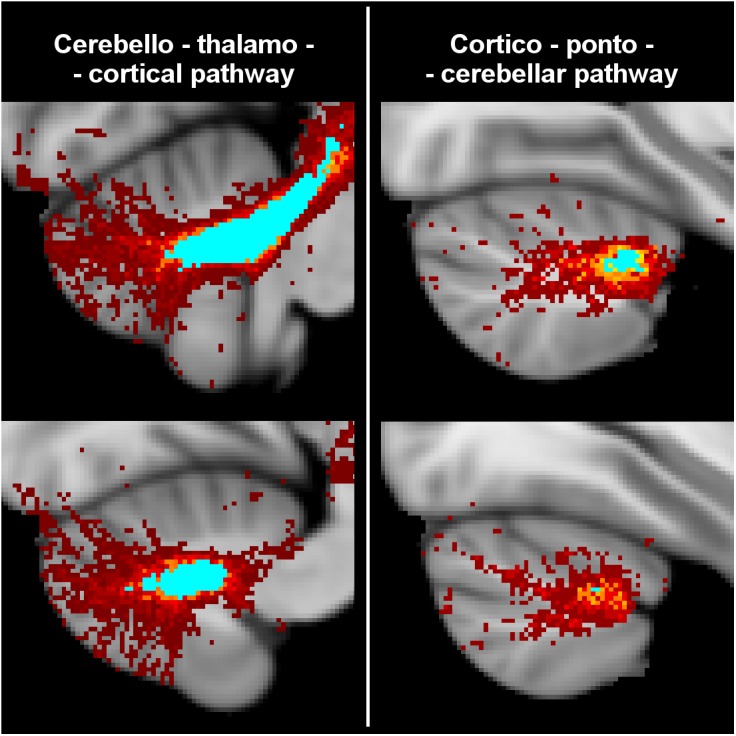
FIGURE 3.

Tractography results from HC were registered to MNI152 standard space at 1 mm resolution to create a population map for each tract. Here are shown the superimposed population maps of the tracts connecting the left hemisphere of the cerebellum to the DMN regions of the right cerebral cortex. On the left are shown cerebello-thlamo-cortical tracts, while on the right are shown cortico-ponto-cerebellar tracts. The voxel color (from dark red to yellow) represents the frequency of occurrence in the specific tract. Light blue regions identify the most consistent part of the tracts, which are common to at least 50% of HC. In the unthresholded population maps, it can be noted that these tracts originate from (cerebello-thalamo-cortical tracts) and project to (cortico-ponto-cerebellar tracts) the posterior lobe of the cerebellum that is associated to cognitive functions.
