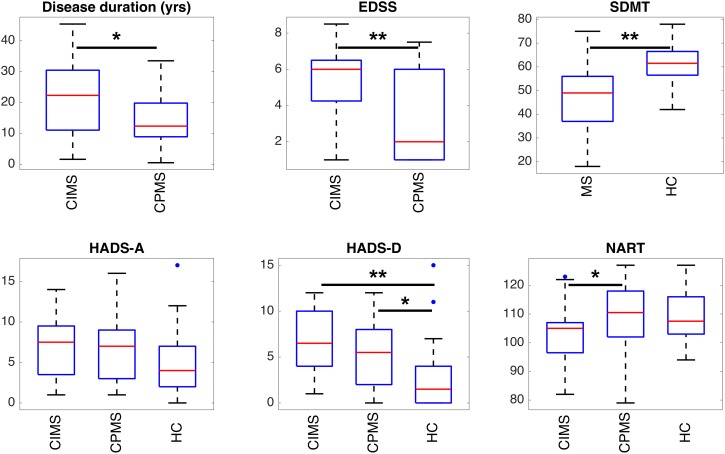
FIGURE 5.
Boxplots representing the summary of clinical scores in the different groups of subjects. Statistically significant differences between groups are indicated with ∗p < 0.05 and ∗∗p < 0.01 according to results obtained with ANOVA post hoc tests or T-tests according to the specific case (see section “Statistical Analysis” and Table 2). It can be observed that SDMT and depression (HADS-D) are significantly different in MS patients and HC. EDSS and, to a lesser extent, disease duration and NART can discriminate between CIMS and CPMS.

