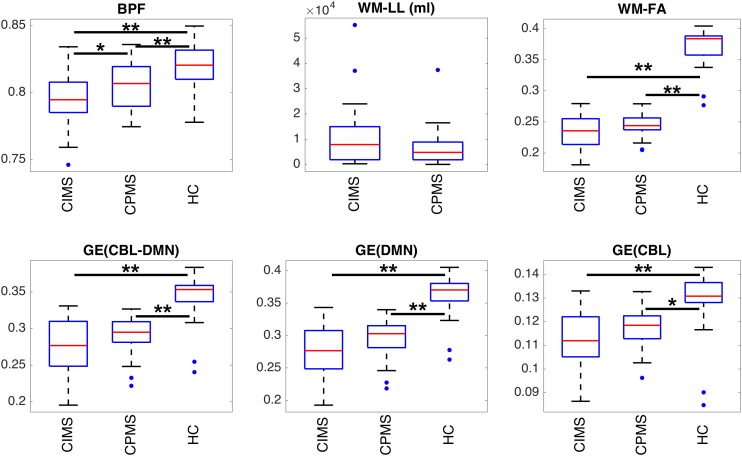
FIGURE 6.
Boxplots representing the summary of MRI metrics in each group of subjects. Statistically significant differences between groups are indicated with ∗p < 0.05 and ∗∗p < 0.01 according to results obtained with ANOVA post hoc tests or T-tests according to the specific case (see section “Statistical Analysis” and Table 2). It can be observed that all measures can distinguish between MS patients and HC. BPF is significantly reduced in CIMS with respect to CPMS. Despite the absence of statistical significance, a similar trend can be observed also for GE and WM-FA.

