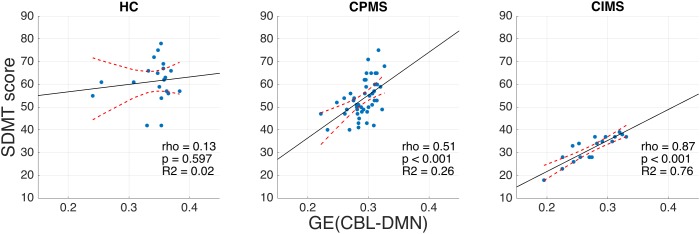
FIGURE 7.
Scatter plots representing SDMT vs. GE (CBL-DMN) for HC (left), CPMS (center), and CIMS (right). Solid black lines represent the linear regression model fit, while dashed red lines represent 95% confidence intervals. It is noteworthy that GE (CBL-DMN) predicts SDMT performance progressively better going from HC (no significant correlation) to CPMS (ρ = 0.51, p < 0.001) to CIMS (ρ = 0.87, p < 0.001). The difference between correlation coefficients for CPMS and CIMS is statistically significant (p < 0.01), as verified by applying Fisher z-transformation.

