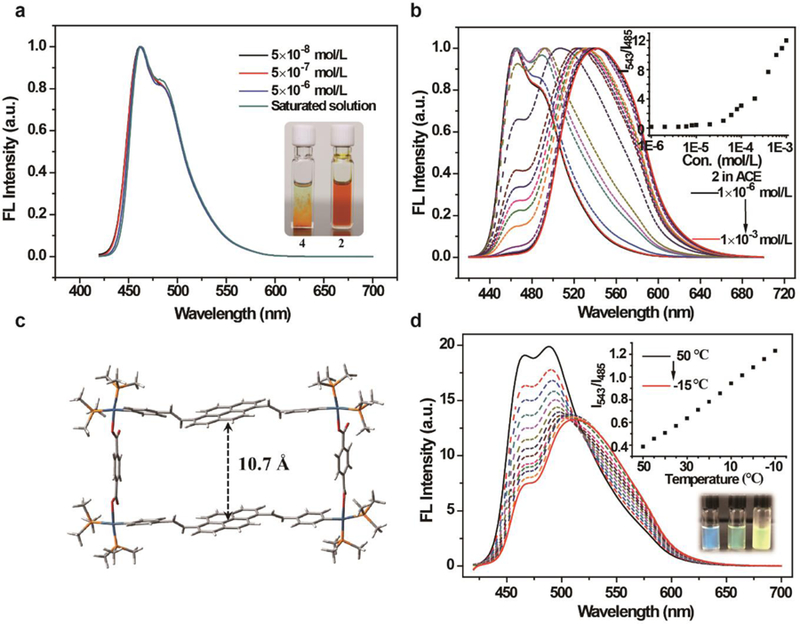
Figure 3.

(a) Normalized fluorescence emission spectra of the acetone solution of ligand 4 recorded at different concentrations and at room temperature, where the inset is the fluorescent pictures of the acetone solutions of ligand 4 (~1.3 × 10⁻⁵ mol/L), and metallacycle 2 (1.0 × 10⁻³ mol/L) taken under UV light (365 nm); (b) Normalized fluorescence emission spectra of the acetone solution of metallacycle 2 recorded at different concentrations and at room temperature, where the inset is a plot of the intensity ratio of I543/I485 against concentration; (c) PM6-simulated geometrical structure of metallacycle 2; (d) Fluorescence emission spectra of metallacycle 2 in acetone with a concentration of 1.0 × 10⁻⁵ mol/L at temperatures from 50 °C to −10 °C (λex = 400 nm), where the inset is a plot of the intensity ratio of I543/I485 against temperature (top) and fluorescent pictures of the solution taken at 50 °C, 15 °C, and −10 °C, respectively, under UV light (365 nm, bottom).
