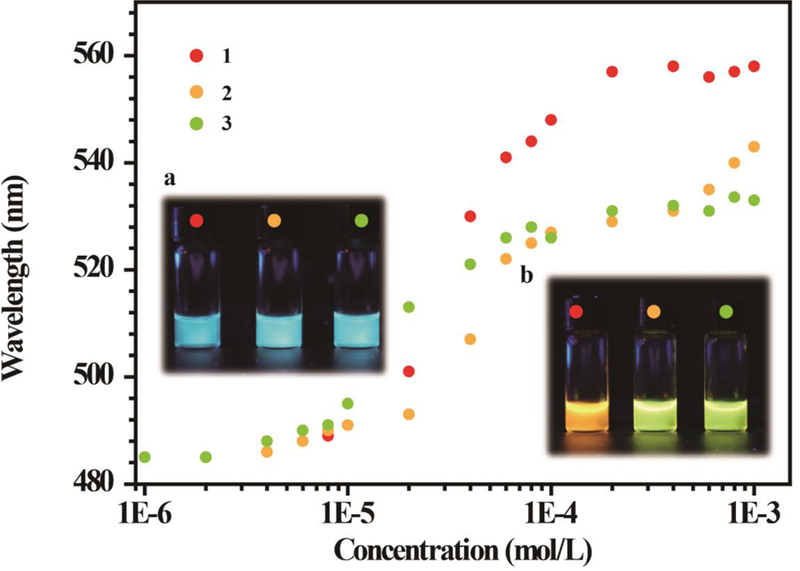
Figure 4.

Plots of the maximum emission wavelengths of the acetone solutions of the three metallacycles 1, 2 and 3 as functions of concentration, where the excitation wavelength employed is 400 nm. The insets a and b are the fluorescent pictures of the solutions with a concentration of 1.0 × 10⁻⁶ mol/L and 6.0 × 10⁻⁴ mol/L, respectively, taken at room temperature and under UV light (365 nm).
