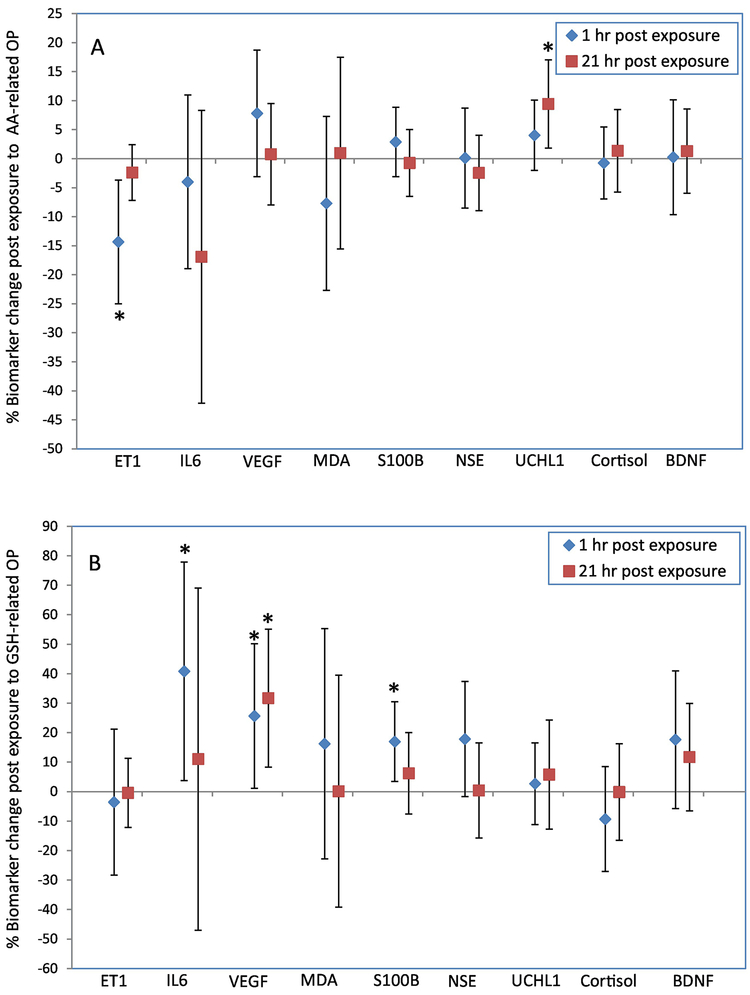
Figure 1.
Percentage change (95% confidence interval) in blood biomarkers 1-hr and 21-hr post exposure to AA-related OP at the mean exposure level (1A), and to GSH-related OP at levels above the limit of detection (1B). Percent change was calculated using the equation: [(post-exposure value minus pre-exposure value)/pre-exposure value]*100. Models were adjusted for age, sex, BMI, season, type of CAPs, mass concentration. *, p<0.05.

