
Fig. 8.
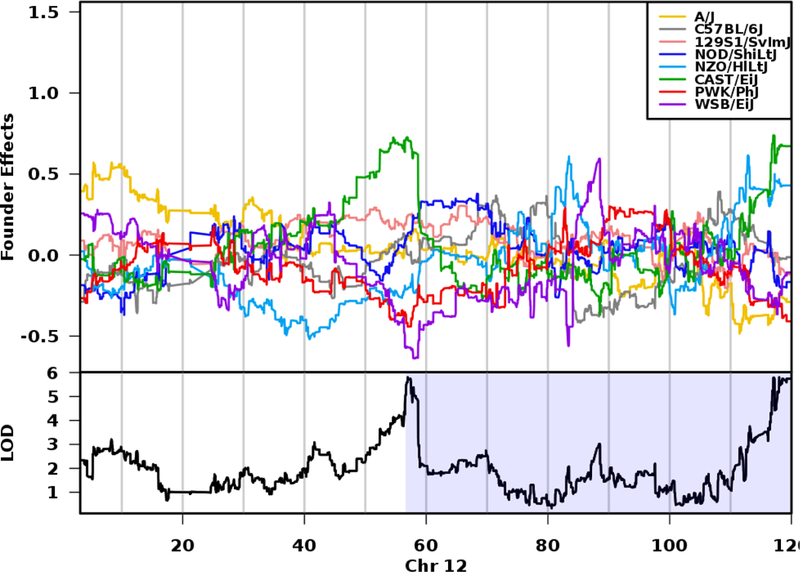
Haplotype effects on chromosome 12 QTL for testis weight. The top panel shows the eight DO founder allele effects (model coefficients) determined by linkage mapping. The x-axis is physical distance in Mb along the chromosome. The y-axis for the top panel is the effect coefficient, and the bottom panel is the LOD score. At ~117 Mb, the CAST/EiJ (green) and NZO/HILtJ alleles (light blue) are associated with larger testis weights. Shading in the bottom panel identifies the 95% credible interval.
Graphics programs: R and Microsoft PowerPoint were used to create figure 8