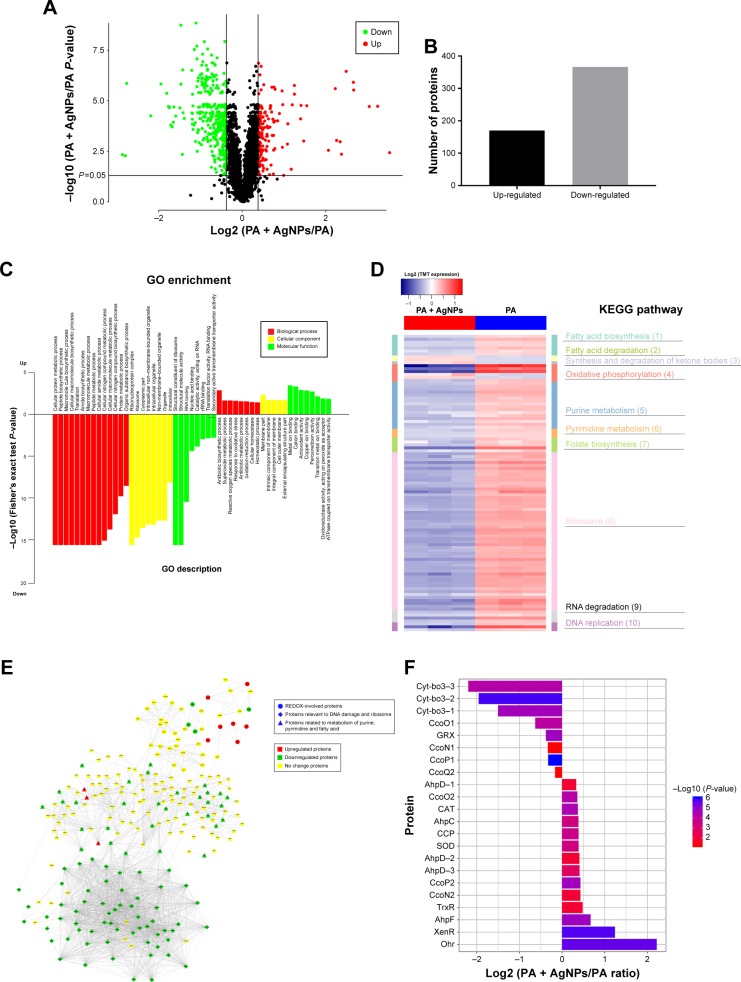
Figure 4.
Expression and function analysis of the proteins identified by TMT-labeled quantitative proteomic in AgNP-treated multidrug-resistant Pseudomonas aeruginosa.
Notes: (A) The volcano map of differentially expressed proteins. The abscissa denotes the ratios of differential expression proteins in the AgNP-treated P. aeruginosa vs those in the untreated bacteria; the ordinate represents the P-values between the two groups. (B) The number of differentially expressed proteins identified by TMT-labeled quantitative proteomic. (C) GO enrichment cluster analysis of the differential proteins. The red color represents the proteins relevant to biological processes; the yellow, cellular localization and the green, molecular function. Those above the horizontal axis are the upregulated proteins and those below the axis are the downregulated proteins. (D) KEGG pathway clustering heat map of the differential proteins. The deeper the blue color, the more significant the enrichment is. (E) The interactive network of three groups of proteins and their differential expression in the AgNP-treated P. aeruginosa vs those in the untreated bacteria. (F) The comparative analysis of oxidative stress-related proteins between pre- and post-AgNP treatment.
Abbreviations: AgNP, silver nanoparticle; GO, Gene Ontology; KEGG, Kyoto Encyclopedia of Genes and Genomes; PA, P. aeruginosa; TMT, Tandem Mass Tag.

