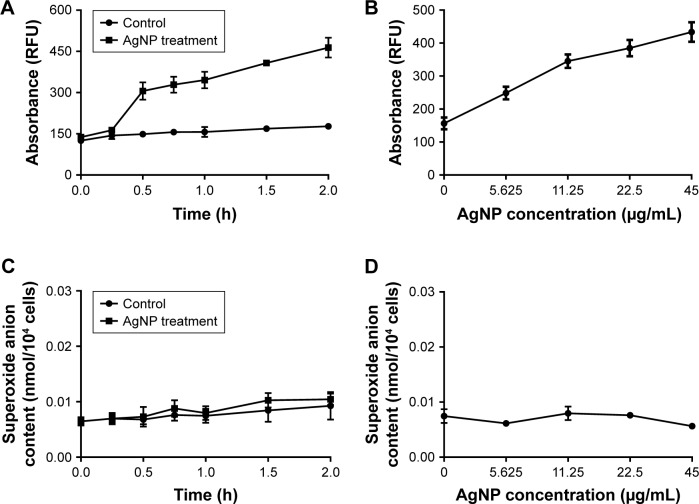
Figure 7.
Changes of ROS and O2− production in AgNP-treated multidrug-resistant Pseudomonas aeruginosa.
Notes: (A) RFU–time curve of ROS production of the bacteria at different AgNP-treated time points of 0, 0.25, 0.5, 0.75, 1, 1.5, and 2 hours. (B) RFU–concentration curve of ROS production of the bacteria, exposed to different AgNPs concentrations of 0, 5.625, 11.25, 22.5, and 45 µg/mL. (C) The O2− content–time curve of the bacteria at different AgNP-treated time points of 0, 0.25, 0.5, 0.75, 1, 1.5, and 2 hours. (D) The O2− content–concentration curve of the bacteria, exposed to different AgNP concentrations of 0, 5.625, 11.25, 22.5, and 45 µg/mL, respectively.
Abbreviations: AgNP, silver nanoparticle; RFU, relative fluorescence unit; ROS, reactive oxygen species.

