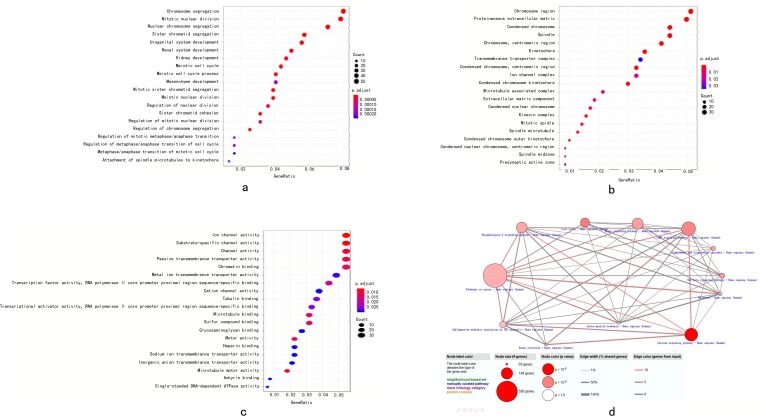
Fig 9.
(a) biological process group of GO analysis. (b) cellular component group of GO analysis. (c) molecular function group of GO analysis.(d) The KEGG analysis. Biological function and KEGG pathway analysis of target genes. The overlapping target genes were predicted using the R language. (a-c) The enriched GO biological processes of target genes. (d) The enriched KEGG pathways of target genes.

