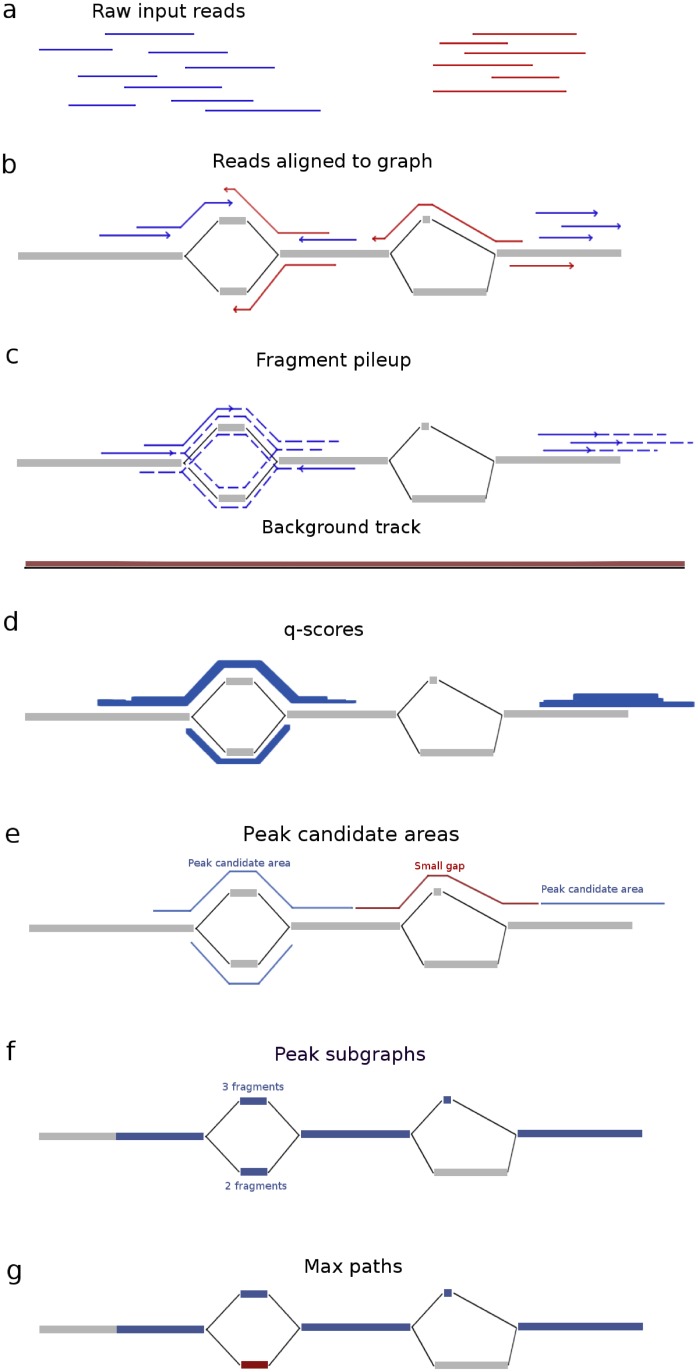
Fig 1. Overview of how Graph Peak Caller works.
Example of peak calling on an example graph (nodes in gray, edges in black). After raw reads (a) in the form of input reads (blue) and control reads (red) have been mapped to the graph-based reference genome and filtered based on mapping quality (b), the fragment pileup is created (c) by extending the forward input alignments and reverse input alignments (extensions shown as dotted lines) along all possible paths in their corresponding direction. A background track is created by projecting the alignments resulting from the control reads onto a linear path and calculating a local average of read counts. Then the linear track is projected back to the graph again. The fragment pileup is treated as counts and the background track as rates in a Poisson-distribution, and p-values are computed for each position for the observed count, given the corresponding rate. Adjusted q-values are computed to control the false discovery rate (d) (figure shows q-scores, which are -log10(qvalue)). The q-values are thresholded on a user-defined threshold (default 0.05), resulting in a set of peak candidate areas with gaps between them (e). Small gaps are filled, resulting in a set of peak subgraphs (connected subgraphs)(f). Graph Peak Caller finds a single “maximum path” (g, maximum path in blue) through each peak subgraph by selecting the path that has the highest number of input reads mapped to it.

