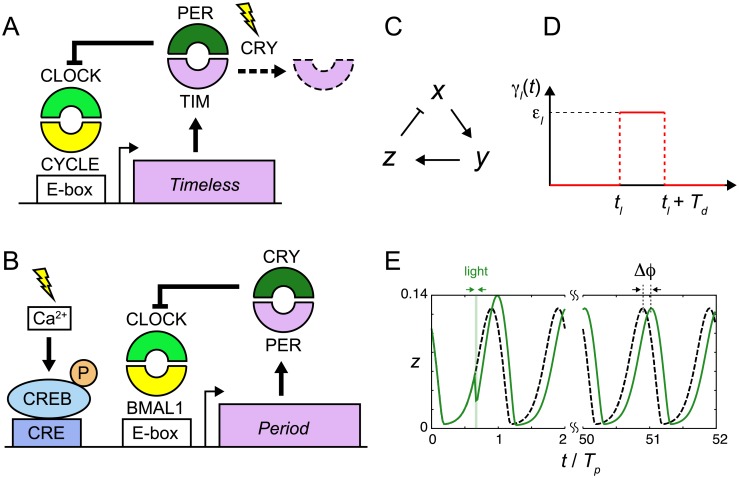
Fig 1. Modeling light responses of the circadian clocks.
(A), (B) Schematic representation of the degradation and induction responses of the circadian clock. (A) Degradation response in Drosophila and (B) induction response in mammals. In (B), light signals increase Ca2+ levels. Subsequently, the elevation of Ca2+ increases the levels of phosphorylated CREB. See also the main text. (C) Negative feedback loop in the three-variable Goodwin model. x, y and z are the levels of repressor mRNA, cytoplasmic protein and nuclear protein, respectively. Nuclear protein represses mRNA transcription as indicated by a line with a perpendicular bar. (D) Change in a biochemical reaction by a light signal γl(t) described by Eq (4). (E) Quantification of phase shift Δϕ. The green solid and black broken lines indicate time series of nuclear protein z with or without light perturbation, respectively. Time in the horizontal axis is normalized by the period of oscillation Tp. We measure the difference in peak times after transient behaviors.

