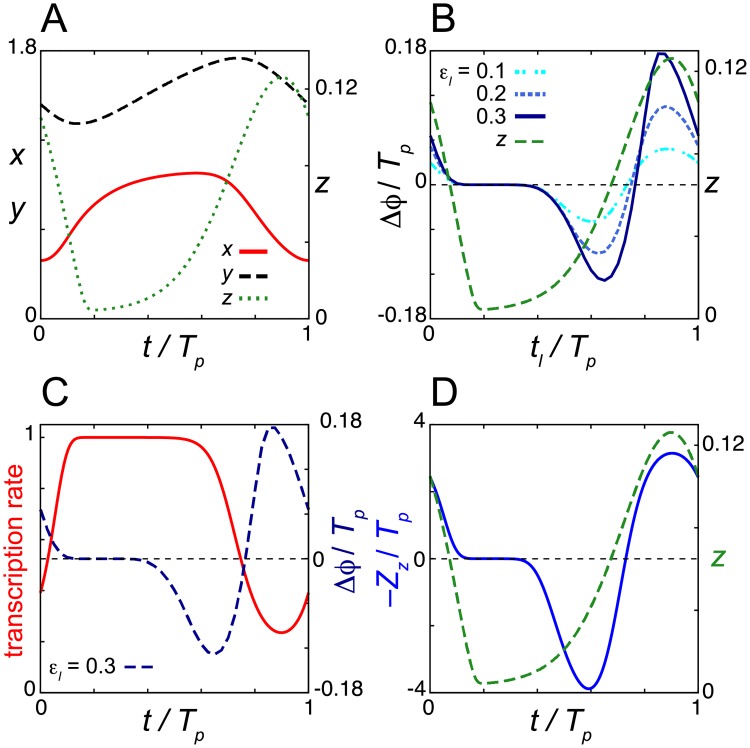
Fig 2. Dead zone generated by the saturation of repressor mRNA transcription in the degradation response.
(A) Time series of the levels of mRNA x, cytoplasmic protein y and nuclear protein z in Eqs (1)–(3) without light signals. (B) Normalized phase response curves (PRC) to light signals. PRCs for different values of the rate of light-induced degradation εl are shown. (C) Time series of the transcription rate 1/(1+(z/K1)n) in Eq (1). The PRC for εl = 0.3 is also plotted (right y-axis) as a reference. (D) Phase sensitivity −Zz (blue solid line). In (B) and (D), the time series of z (green broken line) is also plotted (right y-axis). In all panels, time is normalized by the period of oscillation Tp = 24. Values of reaction parameters in Eqs (1)–(3) are listed in S1 Table. In (B), Td = 0.5Tp/24 = 0.5.

