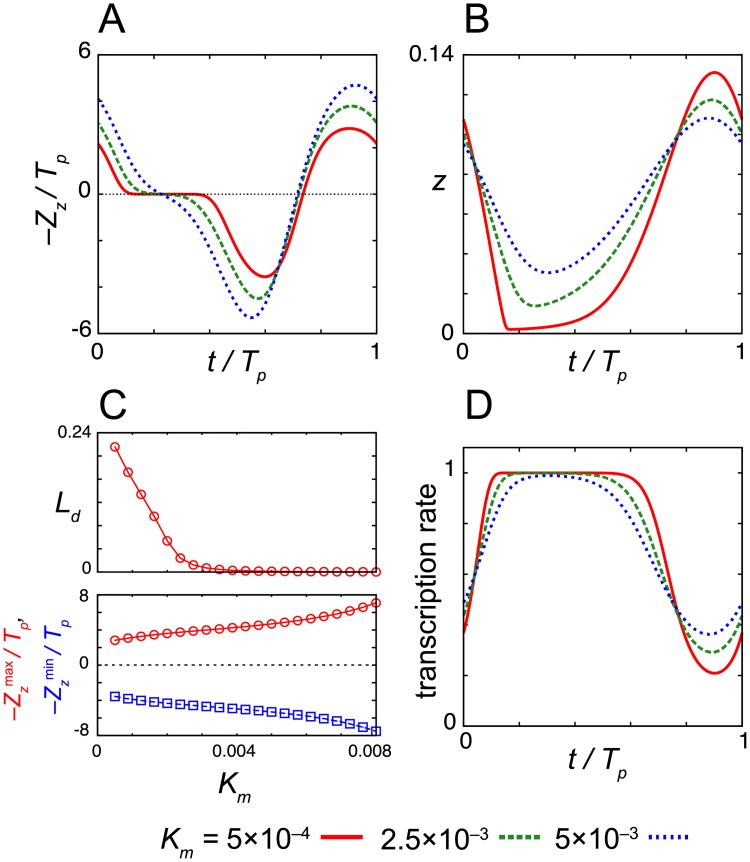
Fig 3. Dependence of the dead zone length on the Michaelis constant for nuclear protein degradation Km.
(A) Phase sensitivity –Zz and (B) time series of the levels of nuclear protein z for different values of Km. (C) Dead zone length Ld (top) and the maximum and minimum values of the phase sensitivity –Zz(max) and –Zz(min) (bottom) as a function of Km. In (A) and (C), the phase sensitivity is normalized by the period of oscillation Tp. (D) Time series of transcription rate 1/(1+(z/K1)n) in Eq (1) for different values of Km. Values of reaction parameters are listed in S1 Table.

