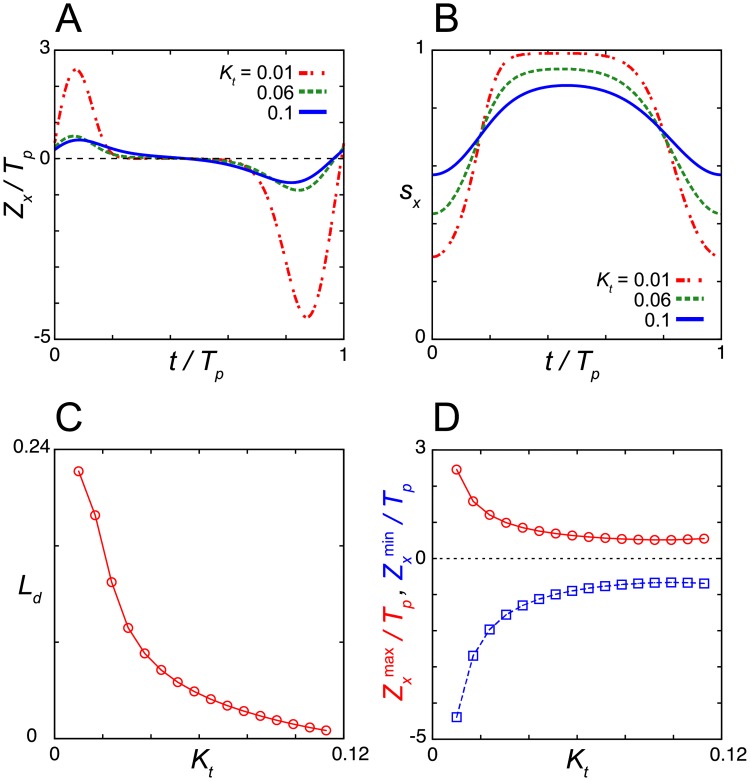
Fig 6. Dependence of dead zone length on the Michaelis constant for translation Kt.
(A) Phase sensitivity Zx for different values of Kt. (B) Time series of the saturation index sx = x/(Kt+x) for different values of Kt. (C) Dead zone length Ld as a function of Kt. (D) Dependence of the maximum and minimum values of the phase sensitivity Zx(max) (red circles) and Zx(min) (blue squares), respectively, on Kt. Tp is the period of oscillation (Tp = 24). Values of reaction parameters are listed in S1 Table.

