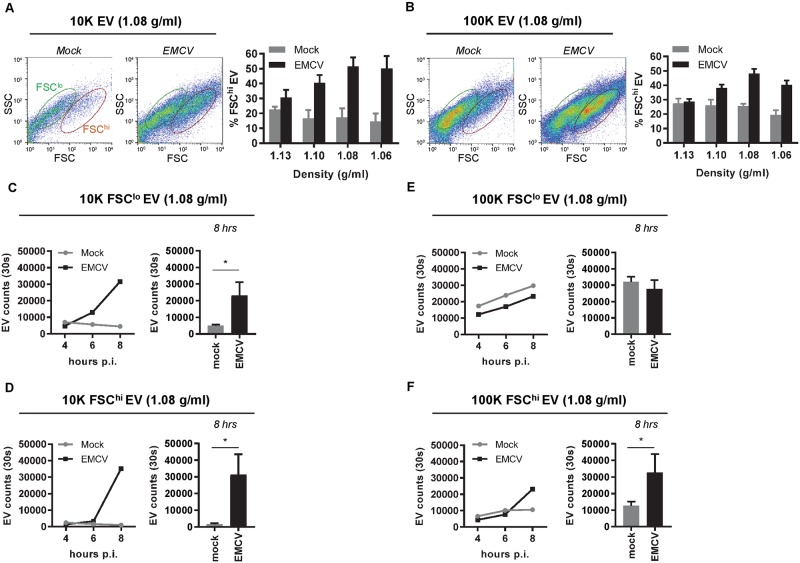
Fig 5. High-resolution flow cytometry reveals heterogeneity in light scattering properties of both 10K and 100K EV released during EMCV infection.
(A,B): 10K (A) and 100K (B) EV from mock and EMCV-infected cells were labeled with PKH67 and analyzed by high-resolution flow cytometry. Depicted are representative FSC-SSC dot plots of EV in the 1.08 g/ml density fractions at 8 hours p.i. and gates indicate FSChi EV (red) and FSClo EV (green)(left panels). Bar graphs display the percentage of FSChi EV in 1.06–1.13 g/ml density gradient fractions in mock versus infected conditions (right panels). (C-F): EV counts were compared for FCSlo (C,E) and FSChi (D,F) subpopulations of 10K (C,D) and 100K (E,F) EV (1.08 g/ml) released by mock and EMCV-infected cells. Indicated are EV numbers acquired in 30 seconds at 4, 6, and 8 hours p.i. Data in line graphs (left panels) are representative for N = 2 (10K EV) or N = 3 (100K) independent experiments. Bar graphs (right panels) indicate the number of FCSlo and FSChi EV in mock versus infected conditions at 8 hrs of culture (mean number of EV acquired in 30 seconds ± s.d. for N = 3 experiments, * p<0.05).

