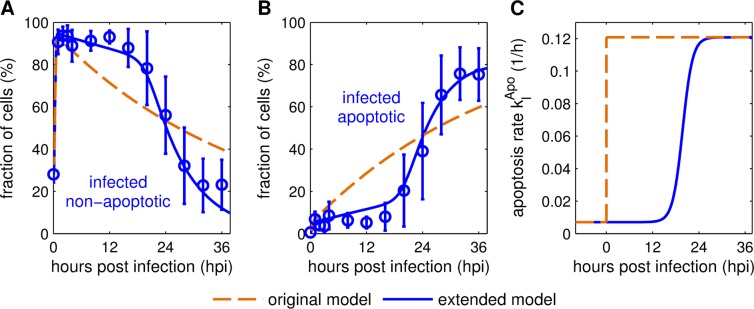
Fig 2. Logistic apoptosis rate enables reproduction of cell population dynamics.
Model fits to cell population measurements from MDCK cell cultures infected with influenza A/PR/8/34 (H1N1) at an MOI of 73 [4]. Mean percentage values of (A) infected, non-apoptotic and (B) infected, apoptotic cells from three independent experiments are shown. Curves represent simulations of the original [24] (dashed) and the extended (solid) multiscale model. (C) Comparison of infected, non-apoptotic cell apoptosis rate dynamics using a stepwise (original model, [24]) and logistically (extended model) increasing virus-induced apoptosis rate . Hours post infection in (A) and (B) refer to the time passed since the cell culture was infected while in (C) it corresponds to the individual infection time point of a cell.

