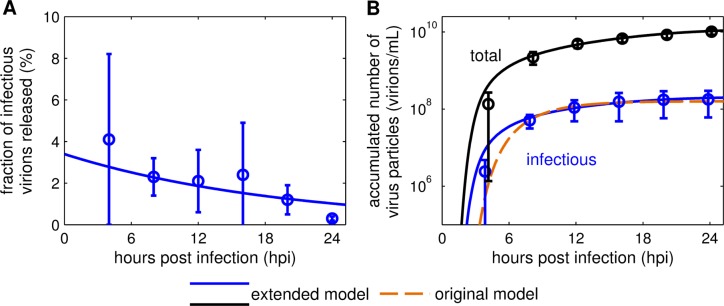
Fig 3. Relation of infectious to total virus particles released.
(A) The fraction of infectious virions released, (B) the accumulated number of infectious and total virus particles were taken from three individual experiments performed in [4]. In brief, adherent MDCK cells were infected with influenza A/PR/8/34 (H1N1) at an MOI of 73. Cumulative viral titers were determined by TCID50 assay and HA assay, respectively. The solid lines represent the model fit to the data with the extended model, (B) the dashed line depicts the model fit with the original model [24].

