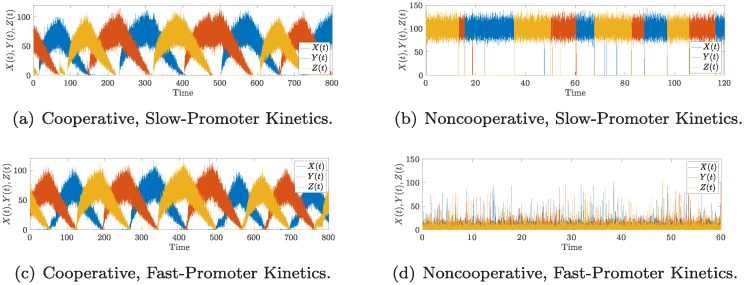
Fig 8. The noncooperative repressilator oscillates.
(a) A time-series for the cooperative repressilator with cooperativity index 2, and slow promoter kinetics. (b) A time-series for the cooperative repressilator with cooperativity index 2, and fast promoter kinetics. (c) A time-series for the noncooperative repressilator, and slow promoter kinetics. (d) A time-series for the noncooperative repressilator, and fast promoter kinetics. The plots were generated by stochastic simulation via the Gillespie algorithm. For all the figures, the parameters are: α = 5ε, α_ = 1ε, k = 2000, k_ = 20, β± = 1, where ε = 0.1 for slow kinetics, and ε = 1000 for fast kinetics.

