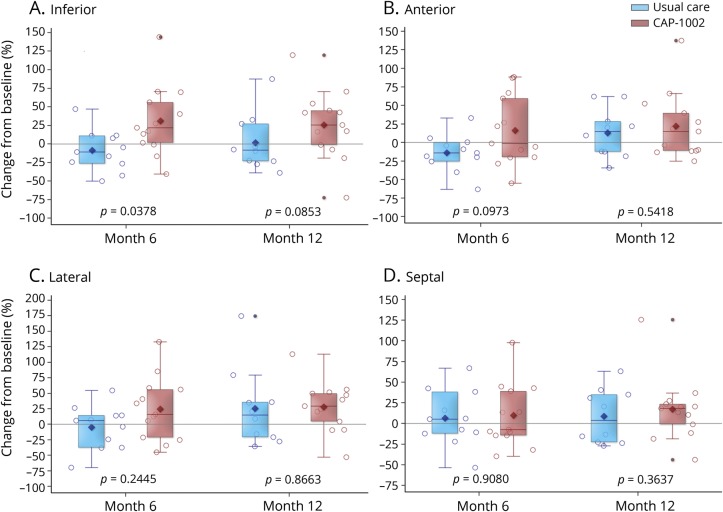
Figure 3. Change in regional myocardial function by MRI.
Relative change from baseline in left ventricular wall thickening via cardiac MRI in the (A) inferior, (B) anterior, (C) lateral, and (D) septal regions is displayed for usual care (blue, n = 11) and CAP-1002-treated (red, n = 13) patients at 6 and 12 months; p values are from repeated measures multivariable linear regression with baseline as a covariate and unstructured covariance. Diamond is the mean, horizontal line within the box is the median, length of the box is the interquartile range, circles are individual observations.

