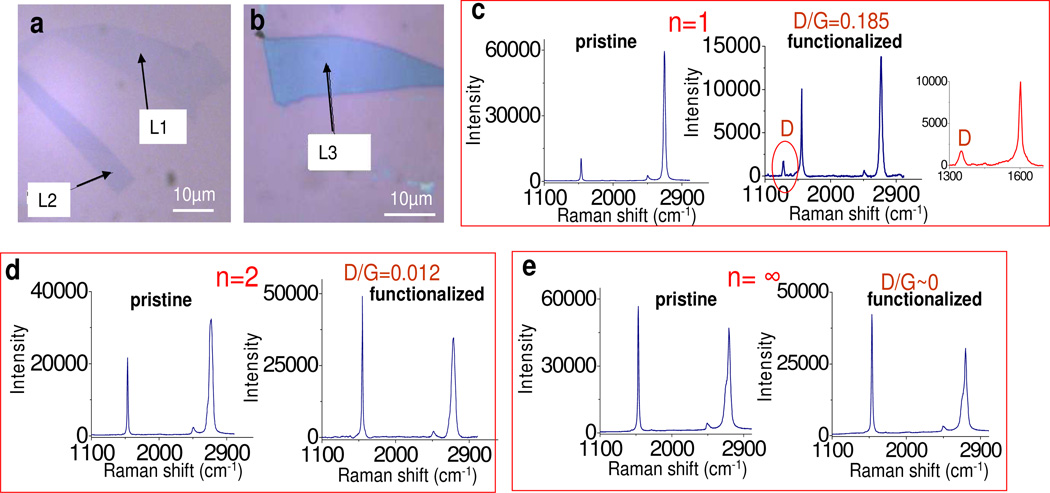
Figure 2.
(a) Microscopic images of a single layer (right), bilayer (left) and (b) multilayer (n~∞) of graphene. (c–e) Raman spectra of pristine (left) and functionalized (right) sheets: (c) spot L1 on single sheet with inset showing expanded 1300–1700 cm−1 region, (d) spot L2 on bilayer and (e) spot L3 on multilayer (n~∞, graphite). There is no D peak for the pristine samples (left spectra). The D/G ratio after reaction of single layer (0.185) is about 15 times higher than for a bilayer (0.012) and greater for other multilayers (~0). Reactions are all performed at 35 °C with 17 mM 4-nitrobenzene diazonium water with 1 wt% SDS.

