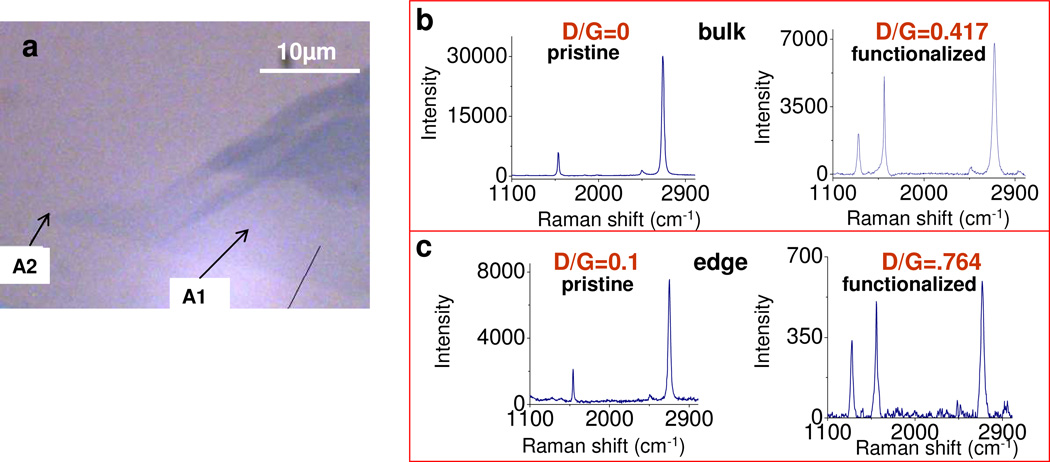
Figure 5.
The graphene edges show markedly higher reactivity. (a) Microscopic image of a graphene sheet with lower portion (lighter color) as single and upper (darker) is 2–3 layers. (b) Raman spectra of A1 (point on bulk single graphene) and c) A2 (point on the edge of single graphene) before (pristine) and after electron transfer chemistry (functionalized). Note that D/G ratio is 0 for bulk (A1) and 0.1 for edge (A2) before chemistry but rises to 0.417 and 0.764 after reaction for the bulk and edge contribution respectively for a single sheet, absent polarized filtering. Reactions are all performed at 45 °C with 25 mM 4-nitrobenzene diazonium water with 1 wt% SDS.

