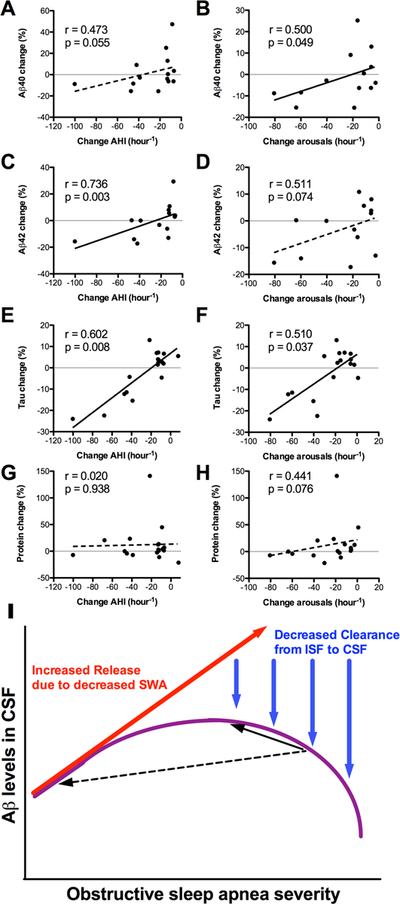
Figure 2 – Change in amyloid-βis associated with change in OSA severity.

Improvement of OSA is shown on the X-axes, with more leftward values indicating greater improvement. The graphs in the left column show change in AHI, while the graphs in the right column show change in arousals per hour. Greater improvement in OSA was associated with decreased (A,B) Aβ40, (C,D) Aβ42, and (E,F) Tau, but not (G,H) total protein. Linear regression lines are shown for illustrative purposes; since the data were not normally distributed, correlations were assessed with Spearman’s correlation coefficient (r=rho) and associated p values. (I) A schematic illustrates two interacting effects of OSA on CSF Aβ levels. With increasing arousals and sleep disruption related to OSA, SWA decreases; this leads to increased Aβ release into the interstitial space (red arrow). However, with worsening OSA severity, there is reduced glymphatic clearance from the ISF to CSF, due to abnormal pressure fluctuations during obstructive respiratory events (blue arrows). The combination of these two effects is hypothesized to result in an inverse U-shape of Aβ in the CSF with increasing OSA severity (purple curve). The black arrows illustrate the direction of change in CSF Aβ following treatment of OSA. If OSA is improved a small degree (solid black arrow), CSF Aβ levels may increase, whereas if OSA is improved a large degree (dashed black arrow), CSF Aβ may decrease.
