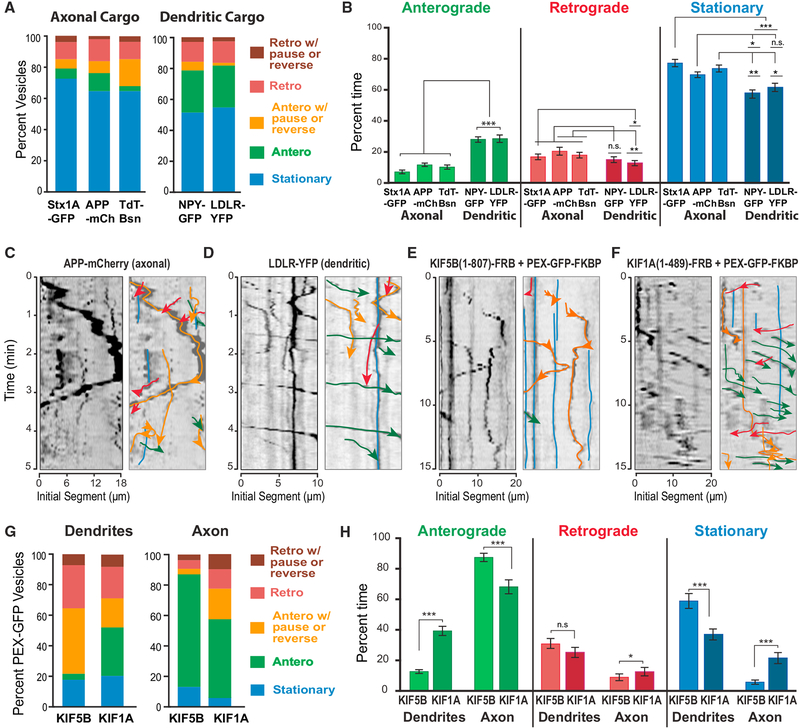
Figure 1. Axonal and Dendritic Motor Cargo Exhibit Differential Motility during Entry into Dendrites.
(A and B) The trajectories of vesicles that move from the cell body into the initial 20-μm segments of dendrites of hippocampal neurons were categorized into stationary, moving processively in the anterograde/retrograde direction, or pausing and reversing while moving anterogradely/retrogradely and graphed as percentage of total vesicles (A). A frame-by-frame analysis was also performed for individual vesicles, deriving the percentage of time spent in pausing, anterograde, or retrograde movement between consecutive frames of each trajectory (B). Quantifications were done for Syntaxin1a-GFP (Stx1A-GFP; n = 220), APP-mCherry (APP-mCh; n = 286) and TdT-Bassoon (Tdt-Bsn; n = 358), NPY-GFP (n = 264), and LDLR-YFP (n = 284) from 15 to 18 dendrites (seven neurons). (C–F) Kymographs show trajectories of vesicles with APP-mCherry (C) and LDLR-YFP (D), and peroxisomes (PEX-GFP) driven by kinesin-1/KIF5B(1–807) (E) and kinesin-3/KIF1A(1–489) (F) in the initial 20-μm segments of dendrites. Labels, line colors, and arrows are as denoted in (A).
(G and H) The trajectories of peroxisomes (G) that move from the cell body into the initial 20-μm segments of dendrites or axons of hippocampal neurons after treatment with rapalog were categorized and graphed as in (A). A frame-by-frame analysis was also performed for individual vesicles, deriving the percentage of time spent in pausing, anterograde, or retrograde movement between consecutive frames of each trajectory (H). Quantifications were done for peroxisomes driven by KIF5B(1–807) into dendrites (n = 86) and axons (n = 85), and by KIF1A(1–489) into axons (n = 66) and dendrites (n = 142) from four to five neurons. *p < 0.05; **p < 0.001; ***p < 0.0001; n.s., not significant (p > 0.05).

