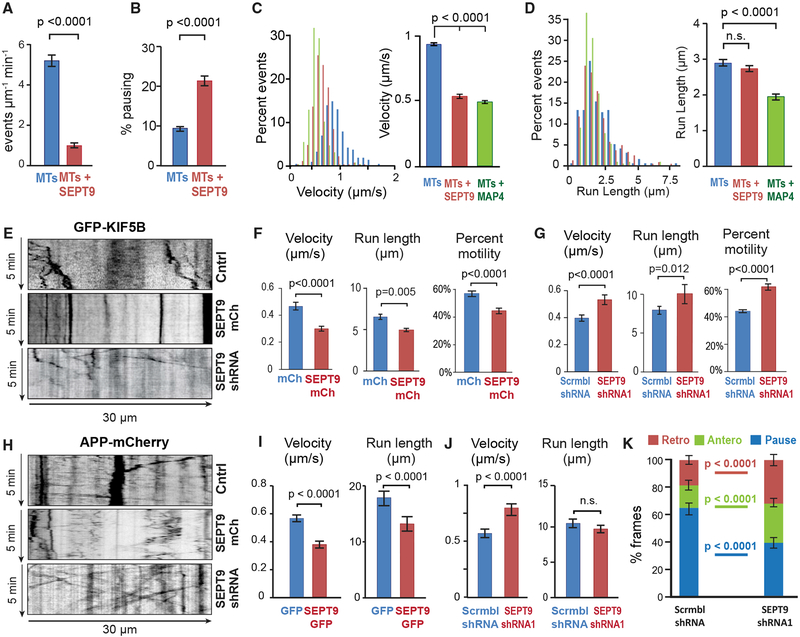
Figure 4. SEPT9 Impedes the Motility of Kinesin-1 and Its Axonal Cargo.
(A and B) Mean (±SEM) landing rate (A) and percentage pausing (B) of KIF5C(1–560)-mCit on MTs alone (n = 4603 events; 17 MTs) or MTs coated with HismCherry-SEPT9 (10 nM; n = 856 events; 21 MTs).
(C and D) Histograms show the distribution of velocities (C) and run lengths (D) of KIF5C(1–560)-mCit on MTs alone (n = 257 events), MTs coated with HismCherry-SEPT9 (10 nM; n = 271), or His-mCherry-MAP4-MTBD (10 nM; n = 254). Bar graphs show mean velocity and run length (±SEM).
(E) Representative kymographs of GFP-KIF5B in the dendrites of hippocampal neurons (DIV12) transfected with scramble (Cntrl) or SEPT9 shRNAs with mCherry, or SEPT9-mCherry.
(F and G) Mean (±SEM) percentage motility (n > 300; 7–10 cells), velocity, and run length (n = 50–102; 7–10 cells) of GFP-KIF5B in dendrites of neurons transfected with mCherry or SEPT9-mCherry (F) and scramble or SEPT9 shRNAs (G).
(H) Kymographs of APP-mCherry in the dendrites of hippocampal neurons (DIV12) transfected with scramble or SEPT9 shRNAs with mCherry, or SEPT9-mCherry.
(I and J) Mean (±SEM) velocities and run lengths of APP-mCherry vesicles (n > 80) in dendrites (n = 15–20; seven or eight neurons) transfected with GFP or SEPT9-GFP (I) or scramble or SEPT9 shRNAs (J).
(K) The movement of each APP-mCherry vesicle (n = 220–290; 16 dendrites, seven or eight neurons) was tracked frame by frame in the initial 20-μm segments of dendrites and categorized into pausing, retrograde or anterograde displacements between consecutive frames, and then quantified as percentage of total time. Graph shows mean percentage (±SEM).
See also Figure S5.

