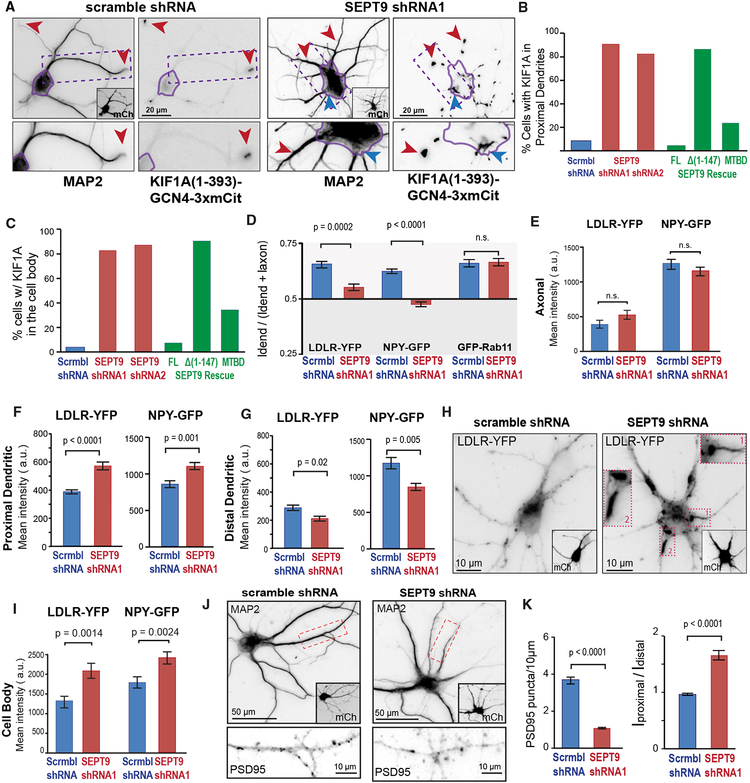
Figure 5. SEPT9 Is Required for Kinesin-3/KIF1A-Cargo Transport from Initial-Proximal to Distal Segments of Dendrites.
(A–C) Images (A) show hippocampal neurons stained for MAP2 after co-transfection with KIF1A(1–393)-GCN4–3xmCit and scramble or SEPT9 shRNAs with mCherry (insets). Cell bodies are outlined in purple. Red arrowheads point to KIF1A accumulation at dendritic tips (scramble shRNA) and dendritic segments proximal to the cell body (SEPT9 shRNAs). Blue arrowhead points to KIF1A accumulation at cell body exit site (shRNA). Bar graphs show the percentage of cells (n = 53–75) with KIF1A in proximal dendrites (B) and in the cell body (C). Rescue experiments were done by co-expressing SEPT9 shRNA with shRNA-resistant SEPT9-mCherry, SEPT9-Δ(1–147)-mCherry, or SEPT9(1–125)-mCherry (MTBD).
(D) Mean polarity index (±SEM) of LDLR-YFP, NPY-GFP, and GFP-Rab11 in hippocampal neurons (n = 20–30, 20–30 neurons) transfected with scramble or SEPT9 shRNAs.
(E–I) Mean intensity (±SEM) of LDLR-YFP and NPY-GFP in axons (E), proximal dendrites (F), distal dendrites (G), and cell bodies (I) (n > 100 dendrites, 20–30 neurons). Images (H) show the localization of LDLR-YFP in neurons transfected with scramble or SEPT9 shRNAs (mCherry; insets). Outlined dendritic segments are shown in higher magnification.
(J and K) Images (J) show the localization of PSD95 in outlined dendritic segments (MAP2) from neurons that express scramble or SEPT9 shRNAs (mCherry, insets). Bar graphs (K) show the mean number (±SEM) of PSD95 puncta per 10 μm of dendritic length and mean proximal-to-distal ratio of dendritic fluorescence intensity (n = 27–29; 93–221 dendrites).
See also Figures S6 and S7.

