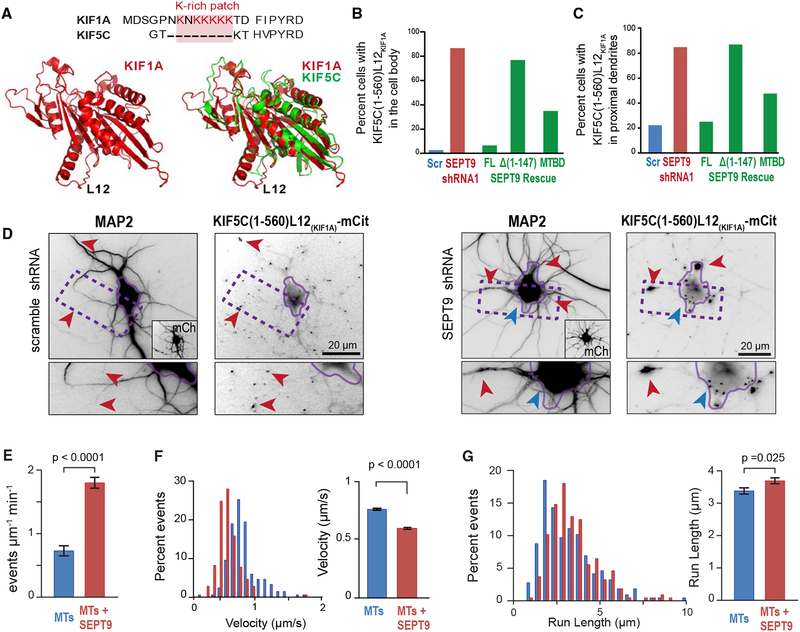
Figure 7. SEPT9 Distinguishes between the L12 Loops of Kinesin-1/KIF5 and Kinesin-3/KIF1A.
(A) Sequence alignment (top) of the L12 of KIF1A and KIF5C, highlighting the lysine-rich patch. Cartoon models (bottom) of the structure of the motor domain of KIF1A alone (left) or superimposed onto KIF5C (right).
(B–D) Bar graphs show percentage neurons (n = 61–110) with KIF5C(1–560)-L12KIF1A-mCit in the cell body (B) and proximal dendrites (C). Images (D) show KIF5C(1–560)-L12KIF1A-mCit localization in hippocampal neurons transfected with scramble or SEPT9 shRNAs. Red arrowheads point to KIF1A accumulation at dendritic tips (scramble shRNA), and blue and red arrowheads point to the base and proximal segments of dendrites, respectively (SEPT9 shRNA). Rescue experiments were performed by co-expressing SEPT9 shRNA with shRNA-resistant SEPT9-mCherry, SEPT9-Δ(1–147)-mCherry or SEPT9(1–125)-mCherry (MTBD).
(E) Bar graph shows the mean (±SEM) landing rate of KIF5C(1–560)-L12KIF1A-mCit on MTs alone (n = 17) or His-mCherry-SEPT9 (10 nM)-coated MTs (n = 19). (F and G) Histograms shows the distribution of KIF5C(1–560)-L12KIF1A-mCit velocities (F) and run lengths (G) on MTs alone (n = 217) or MTs coated with 10 nM HismCherry-SEPT9 (n = 210 events). Bar graph shows mean (±SEM) velocity and run length.

