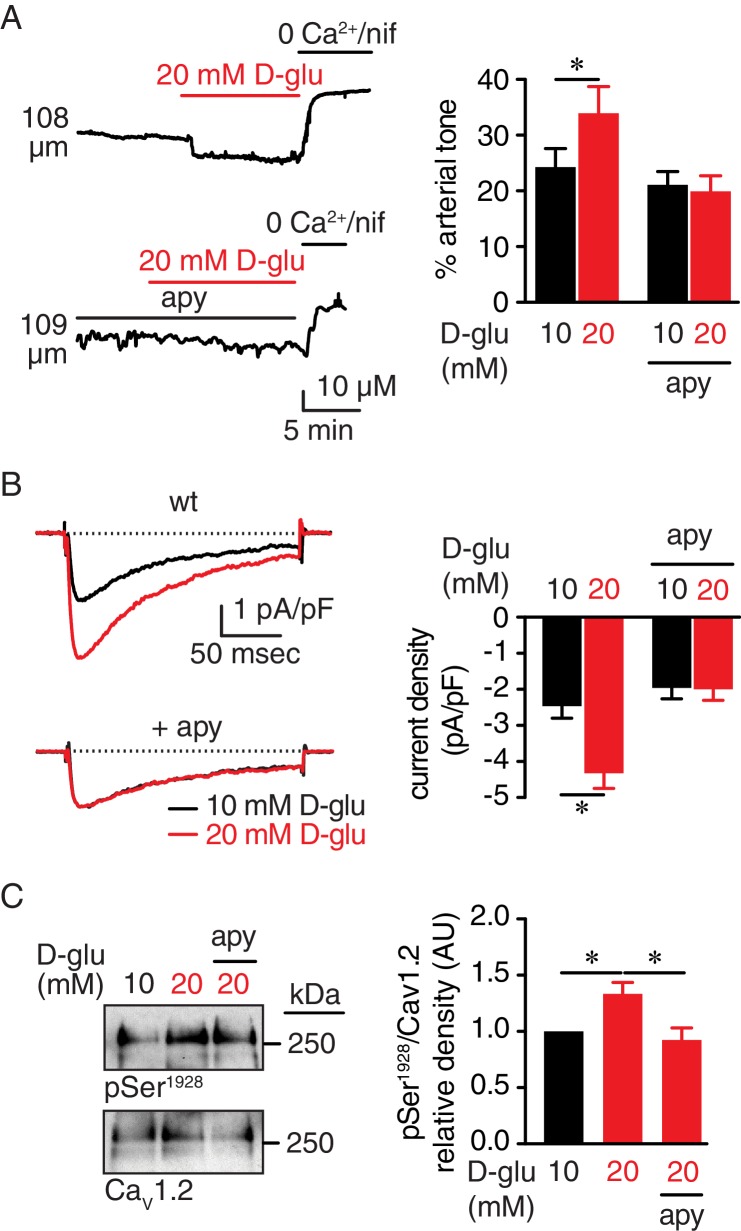
Figure 1. Extracellular nucleotides promote vasoconstriction, CaV1.2 activity and Ser1928 phosphorylation in response to 20 mM D-glucose in murine arterial myocytes.
(A) Representative diameter recordings and summary arterial tone data from pressurized (60 mmHg) wt mouse cerebral arteries before and after application of 20 mM D-glucose in the absence (n = 6 arteries from six mice) and presence (n = 6 arteries from six mice) of apyrase (apy; 0.32 U/ml; *p<0.05, Wilcoxon matched pairs test; Figure 1—source data 1). (B) Characteristic IBa recordings from the same cell and summary IBa data from wt mouse cerebral arterial myocytes evoked by step depolarizations from −70 to +10 mV before and after application of 20 mM D-glucose in the absence (n = 11 cells from five mice) and presence of apyrase (n = 9 cells from five mice) (*p<0.05, paired t test; Figure 1—source data 2). (C) Representative immunoblot detection of phosphorylated Ser1928 (pSer1928) and total CaV1.2 from wt mouse cerebral and mesenteric arteries after 10 min incubation with 10 mM or 20 mM D-glucose in the absence and presence of apyrase (n = 10 arterial lysates per condition), and quantification of pSer1928 (AU = arbitrary units) (*p<0.05, Kruskal-Wallis with Dunn’s multiple comparisons; Figure 1—source data 3).


