. 2019 Mar 1;8:e42214. doi: 10.7554/eLife.42214

Figure 2. P2Y11 protein and distribution in arterial myocytes.

(A) Representative blot of immunoreactive bands of expected molecular weight for endogenous P2Y11 (~40 kDa), overexpressed P2Y11-GFP (~70 kDa), and β-actin (~43 kDa) in untransfected, vehicle-treated (empty transfection) and P2Y11-GFP transfected tsA-201 cells (n = 3 lysates per condition). Note that tsA-201 cells endogenously express P2Y11 (Dreisig and Kornum, 2016). (B) Representative blot of immunoreactive bands of expected molecular weight for endogenous P2Y11 (~40 kDa), overexpressed P2Y11-GFP (~70 kDa), and β-actin (~43 kDa) in tsA-cells transfected with P2Y11-GFP as well as corresponding P2Y11 sense (SNS) or antisense (ANS) ODNs (64% reduction in endogenous P2Y11 expression in cells treated with ANS; 62% reduction in P2Y11-GFP expression in P2Y11-GFP-transfected cells treated with ANS; n = 3 lysates per condition; Figure 2—source data 1). (C) Representative immunoblot detection of P2Y11 (~40 kDa) in lysates from human and wt mouse arteries (n = 3 arterial lysates per sample). (D) Representative confocal images of P2Y11-associated fluorescence (green), wheat germ agglutinin (WGA, red) and merged channels in human (n = 11 cells from three humans) and wt mouse (n = 14 cells from three mice) arterial myocytes. (E) Line profile of the P2Y11- and WGA-associated fluorescence from the area highlighted by the dotted lines in the representative human and mouse arterial myocytes in D.

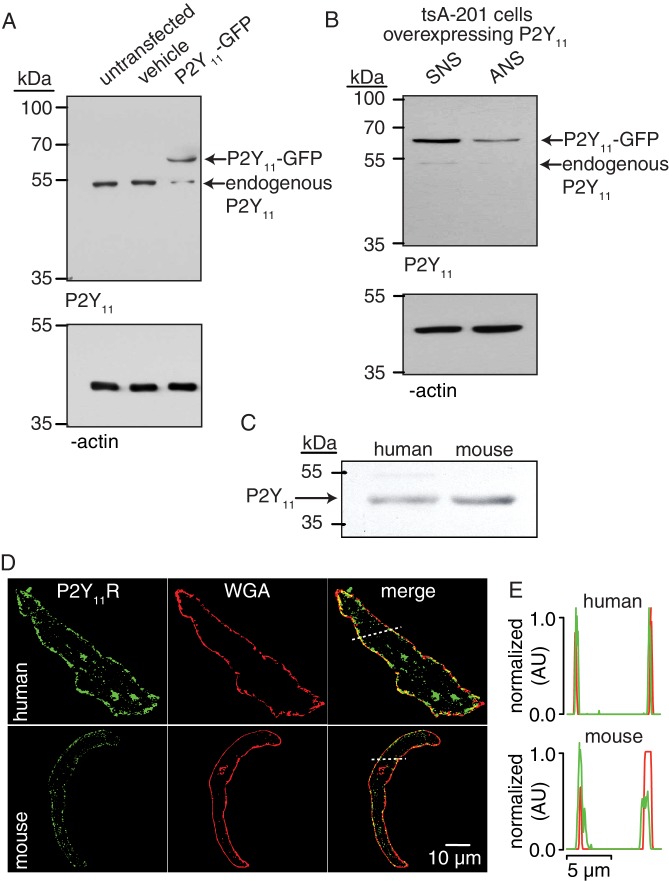
Figure 2—source data 1. Excel spreadsheet containing the individual numeric values of P2Y11/ β-actin relative density corresponding to values reported in legend of Figure 2B.
DOI: 10.7554/eLife.42214.016

Figure 2.

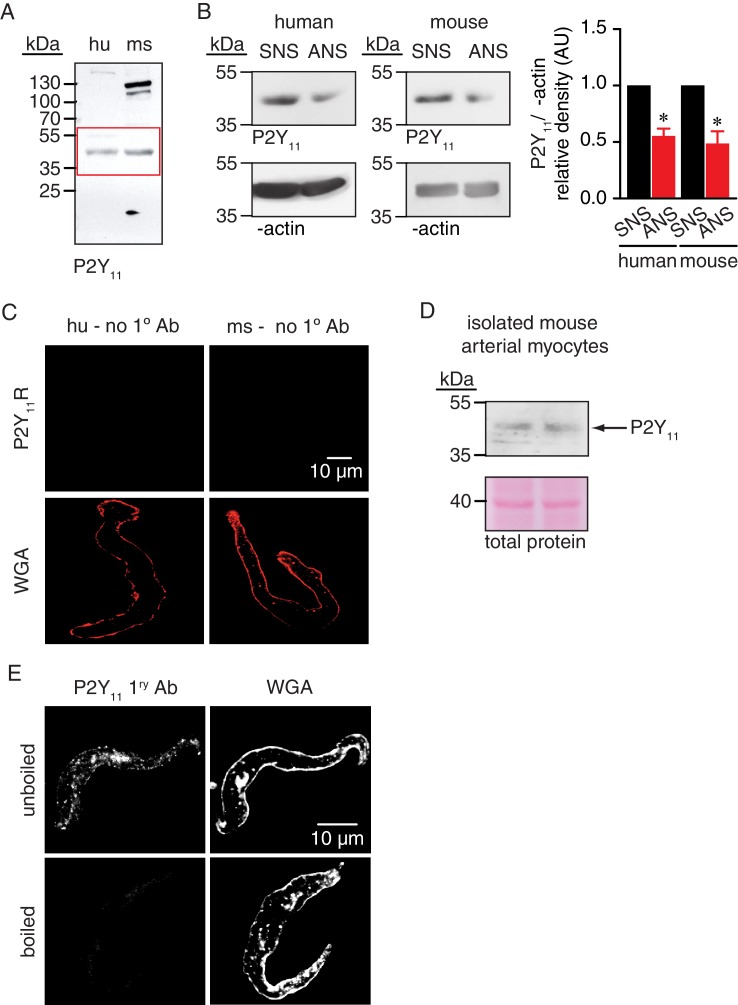
Figure 2—figure supplement 1. Full-length blot for Figure 2C, knock down of P2Y11 in arterial lysates, P2Y11 immunoreactivity in isolated mouse arterial lysates, negative controls for immunofluorescence experiments in Figure 2D and P2Y11 antibody control.

Figure 2—figure supplement 1.

(A) Full-length blot corresponding to Figure 2C. Red box indicates the crop region displayed in main figure. (B) Representative blots of immunoreactive bands of expected molecular weight for P2Y11 (~40 kDa) in human (n = 5 arterial lysates per condition) and mouse (n = 5 arterial lysates per condition) arterial lysates treated with P2Y11 sense (SNS) and antisense (ANS) ODNs (*p<0.05, Wilcoxon matched pairs test; Figure 2—figure supplement 1—source data 1). (C) Representative confocal images of human (left; n = 10 cells from two humans) and mouse (right; n = 10 cells from two mice) arterial myocytes in which the primary antibody for P2Y11 (no 1° Ab) was excluded from the preparation (e.g. negative control). Wheat germ agglutinin (WGA, red) was used to label the plasma membrane. (D) Representative blots of immunoreactive bands of expected molecular weight for P2Y11 (~40 kDa) and total protein in isolated mouse arterial myocyte lysates (n = 2 lysates). (E) Exemplary confocal images of P2Y11-associated fluorescence (left) and wheat germ agglutinin (WGA, right) in wt mouse arterial myocytes stained with unboiled (n = 7 cells from six mice) or boiled (n = 7 cells from six mice) P2Y11 primary antibody.
Figure 2—figure supplement 1—source data 1. Excel spreadsheet containing the individual numeric values of P2Y11/ β-actin relative density analyzed in Figure 2—figure supplement 1B.
DOI: 10.7554/eLife.42214.015