. 2019 Mar 1;8:e42214. doi: 10.7554/eLife.42214

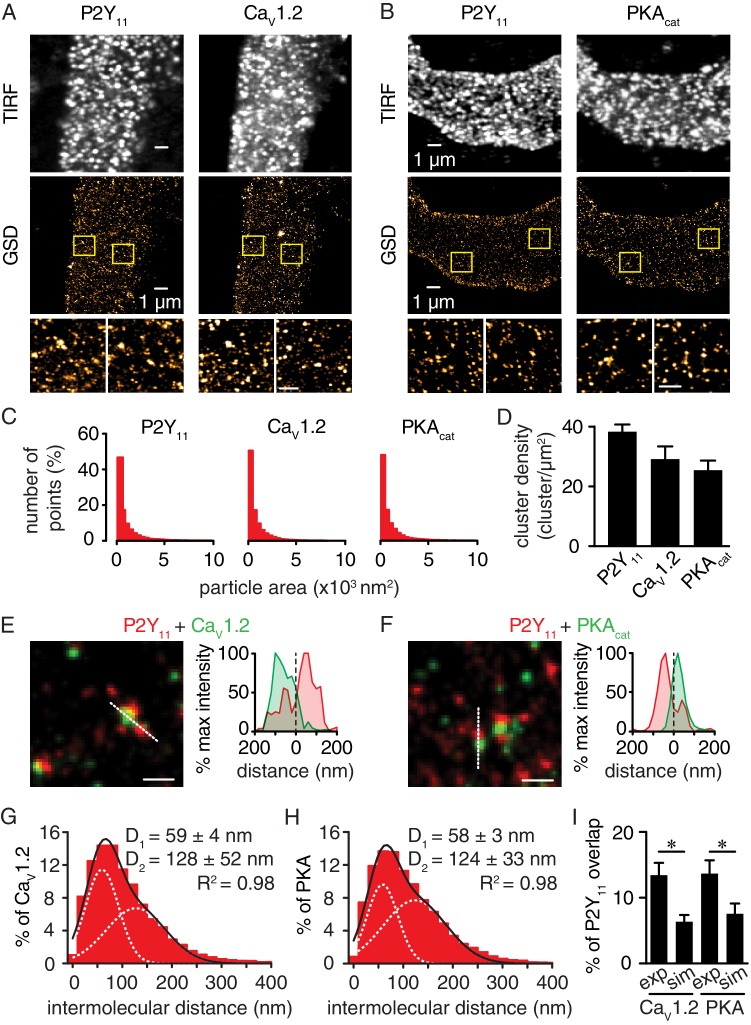
Figure 3. Nanometer organization of P2Y11 with CaV1.2 and PKAcat in human arterial myocytes.

Representative conventional TIRF images (top) and corresponding GSD reconstruction maps (bottom) from human arterial myocytes labeled for (A) P2Y11 and CaV1.2 and (B) P2Y11 and PKAcat. Lower panels display enhanced magnifications of areas shown in yellow boxes (scale bar, 400 nm). (C) Histograms of the area of P2Y11, CaV1.2 and PKAcat clusters in isolated human arterial myocytes (1621 ± 29, 1209 ± 16 and 1322 ± 20 nm2, respectively; Figure 3—source data 1). (D) Bar plot of cluster density for P2Y11, CaV1.2 and PKAcat (38 ± 2, 29 ± 4, and 25 ± 3 clusters/µm2, respectively; Figure 3—source data 2). Enlarged merged image (left) and associated x-y fluorescence intensity profile (right) from area highlighted by the dotted lines of sites of close proximity between (E) P2Y11 (red) and CaV1.2 (green) and (F) P2Y11 (red) and PKAcat (green) (scale bar, 200 nm). Histograms of the lowest intermolecular distance to P2Y11 centroids for (G) CaV1.2 (n = 19,611 particles from 6 cells; Figure 3—source data 3) and (H) PKAcat (n = 22,425 particles from 6 cells; Figure 3—source data 4) fluorescence particles. Data were fit with a sum of two Gaussian functions with depicted R2 and centroids. (I) Bar plot of % overlap of P2Y11 with CaV1.2 or PKAcat for experimental (CaV1.2: n = 36 segments from 12 cells; PKAcat: n = 22 segments from 11 cells) and randomized simulations images (CaV1.2: n = 6 segments from 6 cells; PKAcat: n = 6 segments from 6 cells) (*p<0.05, unpaired t test with Welch’s correction; Figure 3—source data 5).

Figure 3—source data 1. Excel spreadsheet containing the individual numeric values of frequency distribution histograms for cluster area in Figure 3C.
DOI: 10.7554/eLife.42214.025
Figure 3—source data 2. Excel spreadsheet containing the individual numeric values for cluster density in Figure 3D.
DOI: 10.7554/eLife.42214.026
Figure 3—source data 3. Excel spreadsheet containing the individual numeric values of frequency distribution histograms for intermolecular distance in Figure 3G.
DOI: 10.7554/eLife.42214.027
Figure 3—source data 4. Excel spreadsheet containing the individual numeric values of frequency distribution histograms for intermolecular distance in Figure 3H.
DOI: 10.7554/eLife.42214.028
Figure 3—source data 5. Excel spreadsheet containing the individual numeric values for % of P2Y11 overlap in Figure 3I.
DOI: 10.7554/eLife.42214.029

Figure 3.

Figure 3—figure supplement 1. Validation for PKAcat primary antibody.
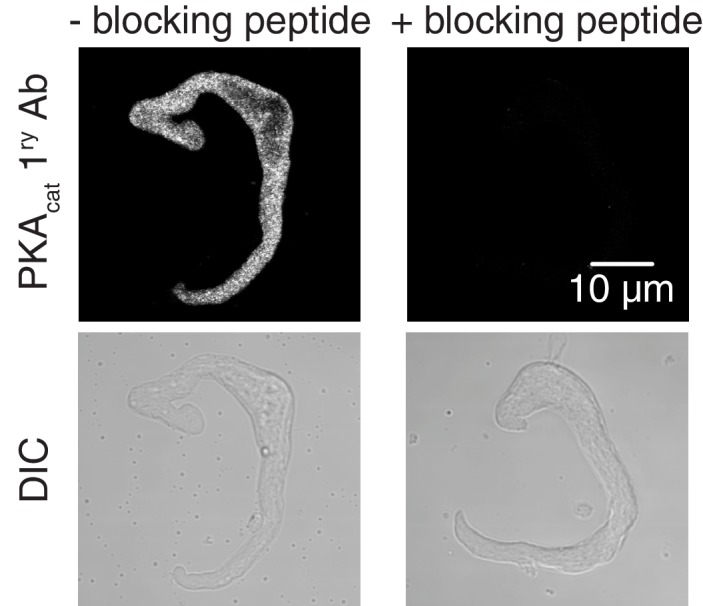
Figure 3—figure supplement 1.

Representative confocal images of PKAcat-associated fluorescence (top) and differential interference contrast (DIC, bottom) in wt mouse arterial myocytes stained with an anti-PKAcat antibody (- PKAcat blocking peptide on left side; n = 7 cells) and an anti-PKAcat antibody preabsorbed with a PKAcat blocking peptide (+PKAcat blocking peptide on right side; n = 8 cells).
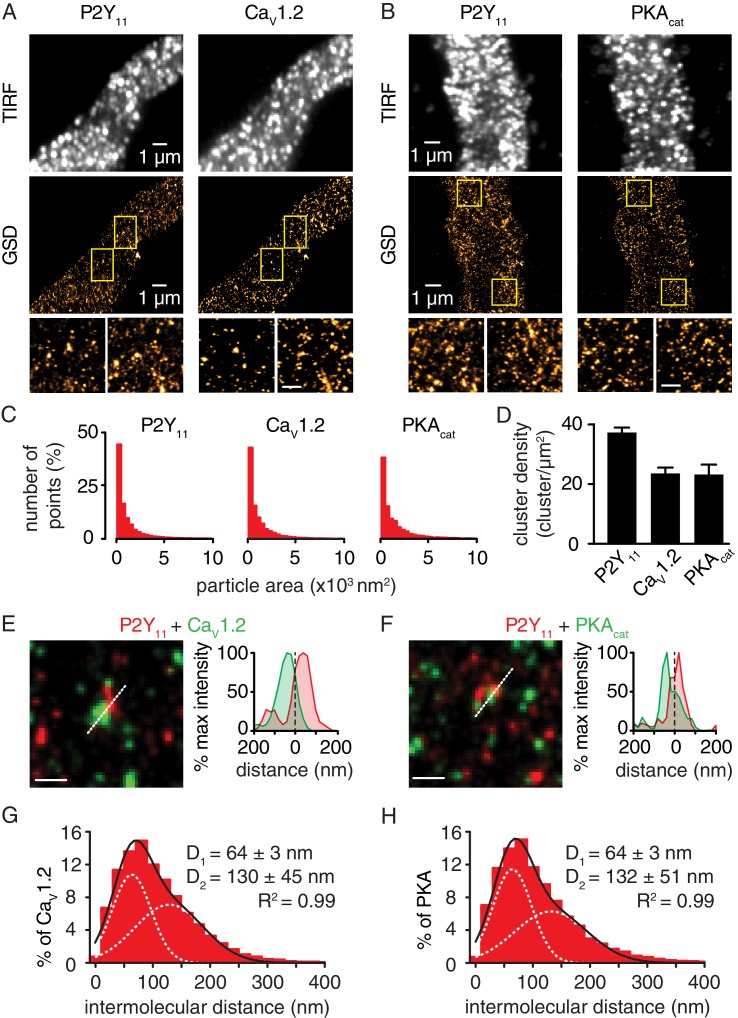
Figure 3—figure supplement 2. Nanometer organization of P2Y11, CaV1.2 and PKAcat in murine arterial myocytes.

Figure 3—figure supplement 2.

Representative TIRF images (top) and corresponding GSD reconstruction maps (bottom) from murine arterial myocytes labeled for (A) P2Y11 and CaV1.2 and (B) P2Y11 and PKAcat. Lower panels show enhanced magnifications of areas highlighted in yellow boxes (scale bar, 400 nm). (C) Histograms of the area of P2Y11, CaV1.2 and PKAcat clusters in arterial myocytes (1803 ± 22, 2111 ± 68, and 1836 ± 28 nm2, respectively; Figure 3—figure supplement 2—source data 1). (D) Bar plot of cluster density for P2Y11, CaV1.2 and PKAcat (37 ± 2, 24 ± 2, and 23 ± 3 clusters/µm2, respectively; Figure 3—figure supplement 2—source data 2). Enlarged merged image (left) and associated x-y fluorescence intensity profile (right) from area highlighted by the dotted lines of sites of close proximity between (E) P2Y11 (red) and CaV1.2 (green) and (F) P2Y11 (red) and PKAcat (green) (scale bar, 200 nm). Histograms of the lowest intermolecular distance to P2Y11 centroids for (G) CaV1.2 (n = 23,722 particles from 6 cells; Figure 3—figure supplement 2—source data 3) and (H) PKAcat (n = 19,219 particles from 5 cells; Figure 3—figure supplement 2—source data 4) fluorescence particles. Data were fit with a sum of two Gaussian functions with depicted R2 and centroids.
Figure 3—figure supplement 2—source data 1. Excel spreadsheet containing the individual numeric values of frequency distribution histograms for cluster area in Figure 3—figure supplement 2C.
DOI: 10.7554/eLife.42214.020
Figure 3—figure supplement 2—source data 2. Excel spreadsheet containing the individual numeric values for cluster density in Figure 3—figure supplement 2D.
DOI: 10.7554/eLife.42214.021
Figure 3—figure supplement 2—source data 3. Excel spreadsheet containing the individual numeric values of frequency distribution histograms for intermolecular distance in Figure 3—figure supplement 2G.
DOI: 10.7554/eLife.42214.022
Figure 3—figure supplement 2—source data 4. Excel spreadsheet containing the individual numeric values of frequency distribution histograms for intermolecular distance in Figure 3—figure supplement 2H.
DOI: 10.7554/eLife.42214.023
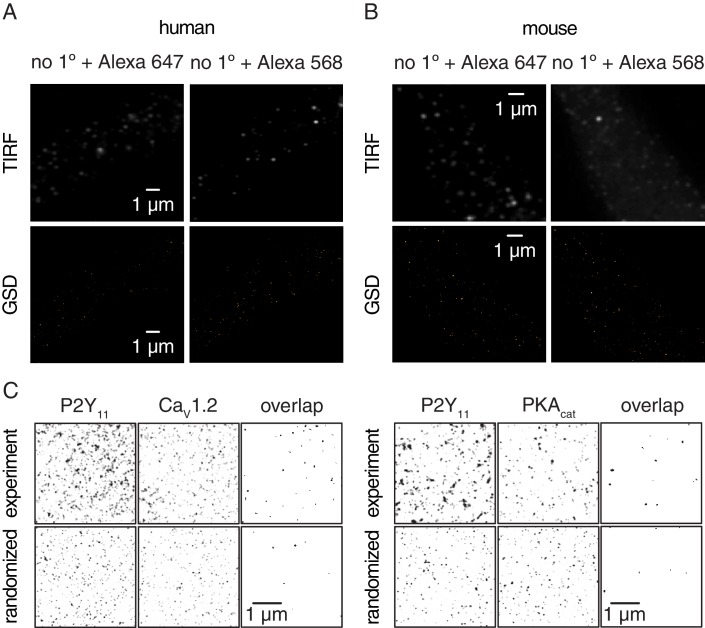
Figure 3—figure supplement 3. Negative controls for GSD images in human and murine arterial myocytes, and experimental and randomized reconstruction maps.

Figure 3—figure supplement 3.

Representative TIRF images (top) and corresponding GSD reconstruction maps (bottom) from freshly dissociated (A) human (n = 6 cells from four humans) and (B) mouse (n = 6 cells from six mice) arterial myocytes labeled with secondary antibodies only (no 1° Ab, Alexa 647 or no 1° Ab, Alexa 568). (C) Representative binarized sub-image area of experimental GSD super-resolution localization maps (top) and randomized simulation distribution images (bottom) for P2Y11 with CaV1.2 (left panels; experimental, n = 38 sub-image area from 12 cells; randomized, n = 6 sub-image area from 6 cells) and P2Y11 with PKAcat (right panels; experimental, n = 24 sub-image area from 11 cells; randomized, n = 6 sub-image area from 6 cells) in arterial myocytes. A smoothing filter was applied to the P2Y11, CaV1.2 and PKAcat images for presentation. Note that randomization data were repeated six times from six different experimental GSD super-resolution localization maps. The overlap images for both experimental and simulated data were generated by multiplying the P2Y11 image by the respective CaV1.2 or PKAcat image, thus revealing overlapping objects.