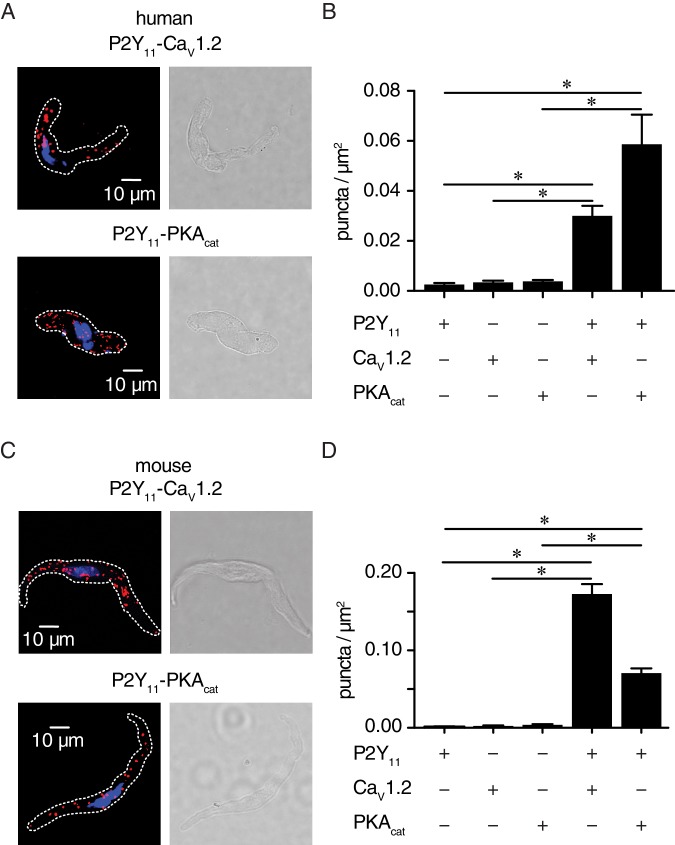
Figure 4. P2Y11 associates with CaV1.2 and PKAcat in human and murine arterial myocytes.
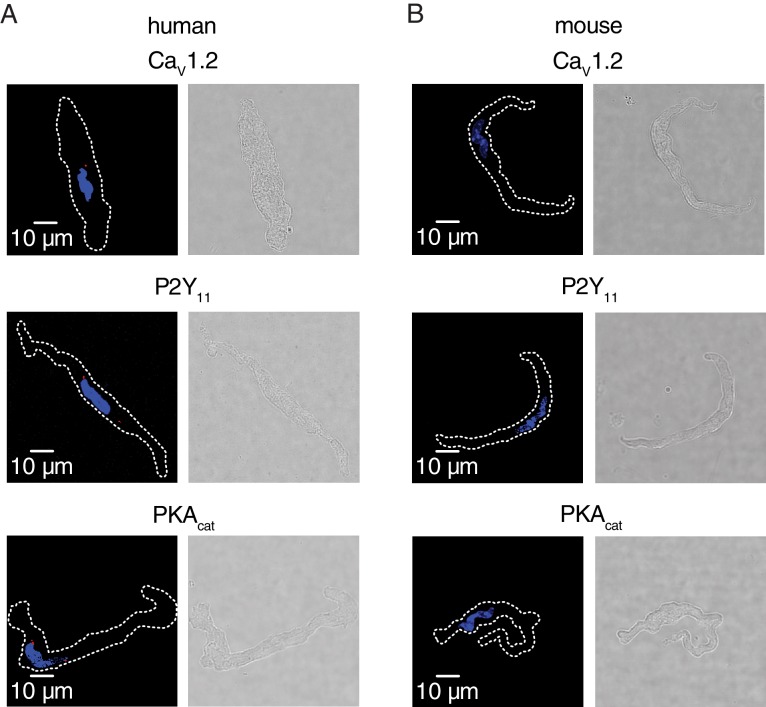
(A) Exemplary fluorescence PLA (red)/DAPI (blue) and differential interference contrast (right) images of human arterial myocytes labeled for P2Y11 + CaV1.2 and P2Y11 + PKAcat. (B) Quantification of PLA fluorescent puncta per cell area (puncta/µm2) for human arterial myocytes labeled for P2Y11 (n = 26 cells from three human samples), CaV1.2 (n = 20 cells from three humans), PKAcat (n = 17 cells from three humans), P2Y11 + CaV1.2 (n = 23 cells from three humans), and P2Y11 + PKAcat (n = 20 cells from three humans) (*p<0.05, Kruskal-Wallis with Dunn’s multiple comparisons; Figure 4—source data 1). (C) Representative fluorescence PLA (red)/DAPI (blue) and differential interference contrast (right) images of mouse arterial myocytes labeled for P2Y11 + CaV1.2 and P2Y11 + PKAcat. (D) Quantification of PLA fluorescent puncta per µm2 cell area for mouse arterial myocytes labeled for P2Y11 (n = 44 cells from six mice), CaV1.2 (n = 15 cells from six mice), PKAcat (n = 19 cells from six mice), P2Y11 + CaV1.2 (n = 25 cells from six mice), and P2Y11 + PKAcat (n = 29 cells from six mice) (*p<0.05, Kruskal-Wallis with Dunn’s multiple comparisons; Figure 4—source data 2).


