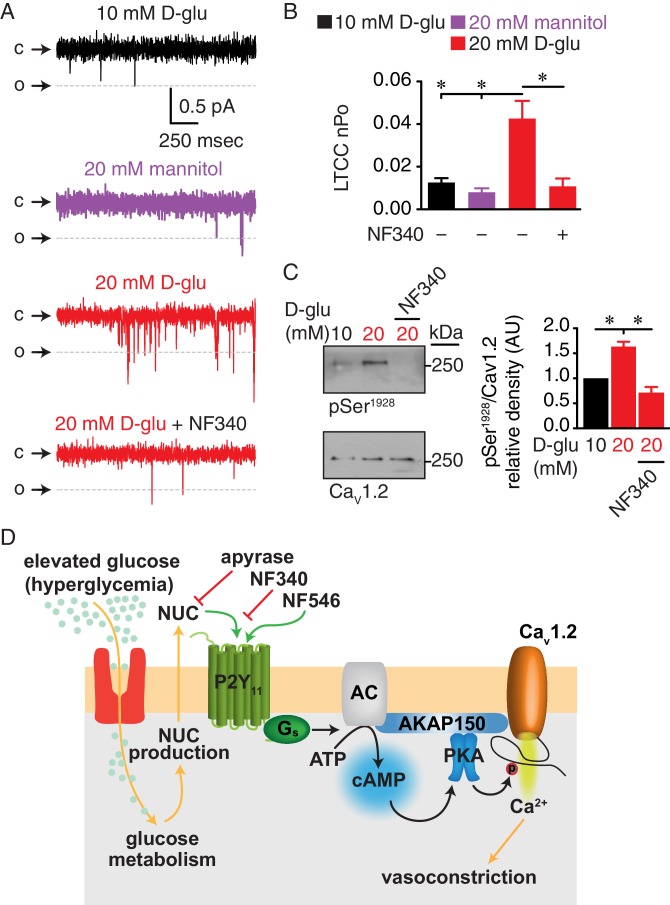
Figure 8. Augmented LTCC activity and Ser1928 phosphorylation in response to chronic extracellular glucose elevations are prevented in the presence of the P2Y11 antagonist NF340.
(A) Representative single LTCC recordings obtained during a 2 s step depolarization from −80 to −30 mV and (B) bar plot of LTCC nPo in arterial myocytes isolated from mouse cerebral arteries incubated for 48 hr in 10 mM D-glucose (n = 10 cells from three mice), 20 mM mannitol (n = 13 cells from four mice), 20 mM D-glucose (n = 10 cells from four mice) and 20 mM D-glucose +10 µM NF340 (n = 10 cells from four mice). Channel openings (o) are represented by downward deflections from baseline (c) (*p<0.05, one-way ANOVA with Tukey post hoc test; Figure 8—source data 1). (C) Representative immunoblot detection of phosphorylated Ser1928 (pSer1928) and total CaV1.2 from mouse cerebral and mesenteric arteries incubated for 48 hr in 10 mM D-glucose, 20 mM D-glucose and 20 mM D-glucose +10 µM NF340 and densitometry quantification of pSer1928/CaV1.2 ratio (n = 7 arterial lysates per condition) (*p<0.05, Kruskal-Wallis with Dunn’s multiple comparisons; Figure 8—source data 2). (D) Proposed model for the role of P2Y11 in PKA-dependent stimulation of LTCC activity and vasoconstriction during diabetic hyperglycemia (NUC = nucleotides).


