Figure 2.

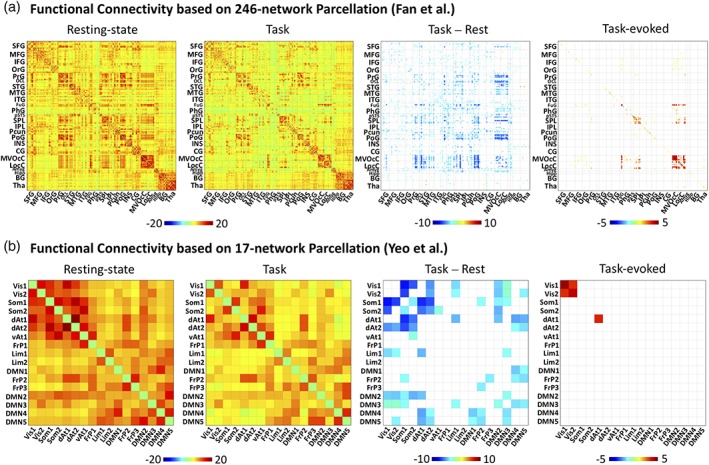
Whole‐brain inter‐regional functional connectivity with two levels of granularity. Cross‐correlation matrices corresponding to the FC during the resting state (far left) and the movie task (left middle), the FC difference during the movie relative to rest (right middle), and the task‐evoked FC computed using the inter‐subject approach (far right). FC matrices were calculated using Fan et al. Brainnetome atlas 246‐region functional parcellation (A, top) and the Yeo et al. 17‐network parcellation (B, bottom). The color bar indicates the average z‐transformed cross correlation values; only significant correlations (q < 0.05) are displayed. Abbreviations for the Yeo parcellation: Vis1, Visual network 1; Vis2, Visual network 2; Som1, Somatomotor network 1; Som2, Somatomotor network 2; dAt1, Dorsal attention network 1; dAt2, Dorsal attention network 2; vAt1, Ventral attention network 1; FrP1, Frontoparietal network 1; Lim1, Limbic network 1; Lim2, Limbic network 2; DMN1, Default mode network 1; FrP2, Frontoparietal network 2; FrP3, Frontoparietal network 3; DMN2, Default mode network 2; DMN3, Default mode network 3; DMN4, Default mode network 4; DMN5, Default mode network 5. The Brainnetome atlas abbreviations are provided in Fan et al. (2016) [Color figure can be viewed at http://wileyonlinelibrary.com]
