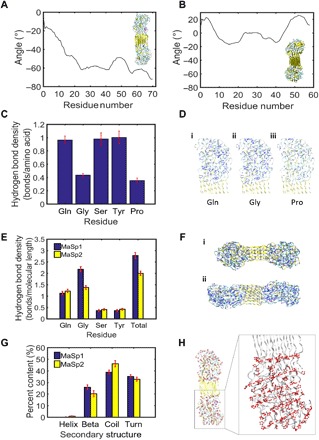
Fig. 5. Mechanisms for humidity-induced torsion in dragline silks on a molecular level.

(A) Representative angle displacement curve for MaSp2, showing consistent and negative angles traveling down the strands, which corresponds to clockwise twist. Inset shows molecular model of MaSp2. (B) Representative angle displacement curve for MaSp1, showing alternating positive and negative angles. Inset shows molecular model of MaSp1. (C) Hydrogen bond density scaled by the number of those residues present in the MaSp2 sequence. Proline shows the lowest hydrogen bond density compared to other residues. (D) Hydrogen bonds (shown in blue) within a 3-Å radius around (i) glutamine (Gln), (ii) glycine (Gly), and (iii) proline (Pro). (E) Hydrogen bond density scaled by end-to-end molecular length within a 3-Å radius around amino acids Glu, Gly, Ser, Tyr, and all amino acids in sequences MaSp1 and MaSp2. (F) Hydrogen bonds shown in blue in (i) MaSp1 and (ii) MaSp2 molecules. (G) Secondary structure content in MaSp1 and MaSp2. (H) The location of proline residues (with proline rings shown in red) in MaSp2 depicts a striated, linear ring orientation. Zoomed panel shows dotted guiding lines representative of linear proline ring orientation. Error bars in (C), (E), and (G) show SD over 1 ns.
