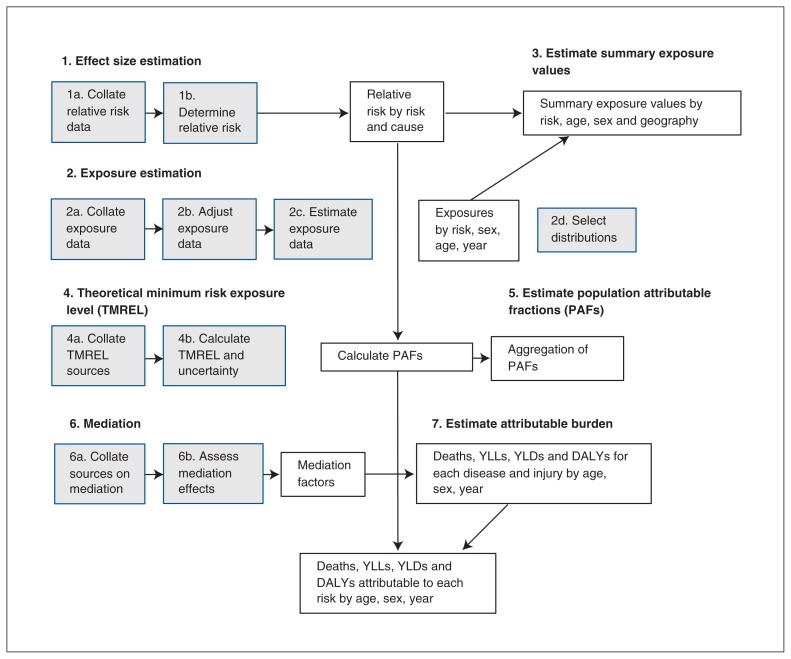
Figure 1:
Simplified analytical flowchart outlining the 7 steps of the comparative risk assessment for the estimation of population attributable fractions by geography, age, sex and year. Note: DALYs = disability-adjusted life years, PAFs = population attributable fractions, TMREL = theoretical minimum risk exposure level, YLDs = years lived with disability, YLLs = years of life lost.

