



Abstract
Background:
Despite the tremendous burden of smell and taste dysfunction in patients with chronic rhinosinusitis (CRS), objective measures of smell and taste fail to fully account for eating-related disruptions in CRS patient quality of life (QOL). This study sought to investigate the driving force behind impaired eating-related QOL in CRS patients.
Methods:
Adult CRS patients were prospectively enrolled and answered a series of surveys relating to smell, taste, overall sinus-specific QOL and depression. Patients with both smell- and taste-related eating complaints were considered to have impaired eating-related QOL. Clinical demographics, objective chemosensory scores and endoscopy scores were collected.
Results:
Seventy patients were enrolled and 23% demonstrated impaired eating-related QOL. In multivariable analyses, patients with aspirin exacerbated respiratory disease (AERD) demonstrated 10.7 times higher odds of impaired eating-related QOL (OR=10.72, 95% CI: 1.09–105.09, p=0.042), meanwhile for every 1 point increase in depression scores, the odds of impaired eating-related QOL increased by 1.3 (OR=1.31, 95% CI: 1.10–1.57, p=0.003). For every 1 point decrease in orthonasal olfactory threshold, the odds of impaired eating-related QOL increased by 1.9 times (OR=1.85, 95% CI: 1.14–3.00, p=0.013). Symptom scores, polyp status, endoscopic scores, and other olfactory measures did not remain significant after adjusting for other variables in forward selection multivariable modeling.
Conclusions:
Disruptions in eating-related quality of life cannot be fully explained by objective smell or taste testing alone. We identified AERD and depression as independent risk factors for greater odds of impaired eating-related QOL in CRS. Improved orthonasal threshold scores independently associated with better eating-related QOL.
Keywords: chronic rhinosinusitis, taste, quality of life, olfaction disorders, taste perception
Introduction:
Eating is an essential component of human life. Beyond providing energy, food is intimately associated with our physiological and emotional states as well as intra- and interpersonal interactions and relationships.1 The experience and subsequent pleasure derived from eating is a complex combination of sensory inputs, including visual, olfactory, gustatory and trigeminal sensations such as texture and temperature. A large survey of patients with chemosensory disturbances (smell and or taste loss) reported diminished pleasure from eating as their most common complaint.2 While it may seem intuitive that eating-related dysfunction would be common in patients with chronic rhinosinusitis (CRS) given the tremendous burden of smell and taste dysfunction amongst this patient population, baseline smell is only weakly associated with patient reported eating-related complaints3–6, and objective taste function in CRS patients has not been shown to correlate with eating-related QOL surveys.7 Although many patients endorse issues of impaired eating-related quality of life (QOL), there are not well-defined, validated instruments to identify this group or measure the impact of impaired eating.
Patients with chronic rhinosinusitis (CRS) are afflicted with functional changes in both smell and taste, resulting in significant impacts on QOL.3,4,7,8 While changes in smell are a cardinal symptom of CRS and documented in up to 83% of patients afflicted with this disease9, the role of taste dysfunction in CRS is not as well described.7 Though not all patients with CRS-related olfactory dysfunction are equally affected, olfactory dysfunction has been associated with reduced QOL, psychosocial implications and direct changes in eating habits.2–5 Despite the implications of chemosensory dysfunction in CRS, objective measures alone do not appear to account for all of the psychosocial impact, given their weak correlation with current QOL instruments. In addition, patients with impaired eating-related QOL often complain most of missing their “favorite” foods, such as coffee or wine, thus the impact of individual odors or tastes upon eating-related QOL is unknown.
In this report, we sought to investigate the driving force behind poor subjective eating-related QOL in CRS patients. Our objectives of this study were: 1) identify a cohort of CRS patients with impaired eating-related quality of life; 2) determine patient-related and CRS disease-related factors associated with impaired eating-related QOL; 3) explore the relationship between specific odors, delivered orthonasally and retronasally, with eating-related QOL. All of these objectives represent an overall goal of better understanding the complex relationship between objective and subjective smell and taste with overall eating-related QOL in CRS patients, as well as potentially modifiable factors to improve CRS-related QOL.
Methods:
Enrollment:
Adult patients, 18 years of age or older, with CRS were prospectively enrolled from a tertiary care rhinology practice in a cross-sectional fashion. All patients fulfilled diagnostic criteria for CRS according to the Clinical Practice Guideline of the American Academy of Otolaryngology–Head and Neck Surgery 10 Basic patient demographics such as gender, race, ethnicity and comorbid conditions including nasal polyp status, asthma, smoking history and other related conditions were collected on all patients. Patients with sinus surgery within the last 3 months, currently pregnant, or neurologic conditions such as Parkinson’s disease, multiple sclerosis and Alzheimer’s disease were excluded. This study was approved by the Medical University of South Carolina institutional review board and written informed consent was obtained from all participants.
Eating-related quality of life:
Isolated dysfunction of smell or taste variably impacts eating, therefore we sought to examine the impact of both of these senses in tandem. In an attempt to identify patients with impaired eating-related QOL, a combination of questions from two validated surveys were used. The first component of eating-related QOL is Factor 2 of the Questionnaire of Olfactory Disorders Negative Statements (QOD-NS) survey as described by Mattos et al.5 This instrument was used to assess the impact of changes in sense of smell on eating-related habits and consists of 4 eating-related statements that are graded on a scale from 0 to 3, for a total score of 12, with higher scores corresponding to worse QOL. Individual statements are listed in Figure 1. The second component used to define eating-related QOL was patient reported taste and degree of dysfunction using the Chemosensory Complaint Score questionnaire (CCS).11 This survey includes 8 taste-related statements, 2 of which related specifically to eating. In the first statement, 1 point was given if the patient reported that food tastes different than it used to. For the second statement, one point given for mild or moderate dysfunction and two points for severe or incapacitating taste dysfunction. (Figure 1). We defined patients as having impaired eating-related QOL if both their QOD-NS Factor 2 score was greater than or equal to 5 and their CCS-taste score was greater than 2. A QOD-NS Factor 2 score of greater than or equal to 5 was set as a cutoff score such that, on average, patients had more than 1 positive response for each question of the survey, suggesting at least a moderate impact of their olfactory dysfunction on their eating-related QOL. Furthermore, a CCS score of greater than or equal to 2 corresponds with a “severe” or “incapacitating” taste-related complaint. In an attempt to isolate patients with the most severely impacted eating-related QOL, patients were labeled as having impaired eating-related QOL if they met criteria from both surveys.
Figure 1:
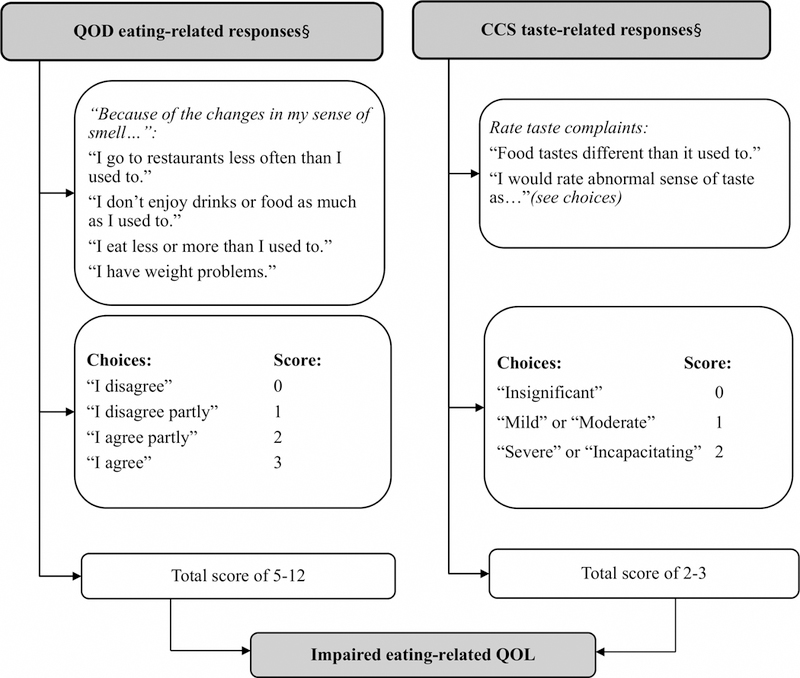
Identification of patients with eating-related QOL impairment using select questions on the QOD and CCS pertaining to subjective reports of eating experience related to smell and taste changes QOD=Questionnaire for Olfactory Dysfunction, CCS=Chemosensory Complaint Score §Higher score correlates with higher disease severity in overall battery.
CRS disease severity:
Nasal endoscopy and patient-reported outcome measures were used to classify sinus disease severity. Sinonasal endoscopy was performed and scored using the Lund-Kennedy12 and Olfactory Cleft Endoscopy Scoring (OCES)13 systems by treating physicians who were blinded to the patient’s data. Patients were also classified as having CRS with nasal polyps (CRSwNP) or CRS without nasal polyps (CRSsNP) based on nasal endoscopy. Participants rated their sinus-specific QOL using the 22-item Sino-Nasal Outcome Test (SNOT-22).14 The SNOT-22 contains 22 questions each scored 0–5 (total score range 0–110), with higher scores representing worse QOL. Patients also completed a Patient Health Questionnaire-9 (PHQ-9) survey, which is a brief validated tool to screen for depression.15
Olfactory measures:
Orthonasal olfaction
Olfactory testing was performed using the Sniffin’ Sticks test (Burghart Instruments, Wedel, Germany). The test battery included odor threshold, odor discrimination, and odor identification. The threshold test was performed using dilution of n-butanol in a single-staircase, triple-forced choice procedure and scored from 1–16. In the discrimination test, subjects were asked to identify the different odor after randomly being presented with 16 sets of triplet pens with two containing the same odorant. This was scored from 0 to 16. The identification test used a multiple-choice procedure where sixteen odorants were presented at supra-threshold intensity. A “composite threshold-discrimination” (TDI) score, which ranged from 1 to 48, was then obtained by summing up all three scores.16 The odors assessed in both orthonasal and retronasal testing are listed in Table 5.
Table 5.
Associations between impaired eating-related QOL and correct identification of individual odors
| Impaired eating-related QOL |
Impaired eating-related QOL |
||||
|---|---|---|---|---|---|
| Orthonasal odor | Yes (n=16) |
No (n=54) |
Retronasal odor | Yes (n=16) |
No (n=54) |
| Anise*†† | 25% | 72% | Bread† | 6% | 43% |
| Liquorice† | 31% | 72% | Grape† | 57% | 83% |
| Orange† | 50% | 87% | Orange | 57% | 65% |
| Fish† | 36% | 76% | Milk | 13% | 37% |
| Clove† | 36% | 72% | Curry | 31% | 57% |
| Garlic† | 44% | 77% | Garlic | 44% | 67% |
| Peppermint† | 50% | 83% | Peach | 57% | 80% |
| Leather† | 72% | 44% | Smoked Ham | 57% | 78% |
| Cinnamon | 31% | 50% | Grapefruit | 50% | 30% |
| Banana | 56% | 76% | Cinnamon | 75% | 83% |
| Coffee | 56% | 76% | Banana† | 31% | 63% |
| Apple | 13% | 30% | Coffee | 69% | 70% |
| Pineapple | 38% | 56% | Apple | 38% | 48% |
| Rose | 69% | 72% | Cocoa | 50% | 39% |
| Lemon | 69% | 65% | Mushrooms | 50% | 67% |
| Turpentine | 25% | 46% | Ginger | 69% | 54% |
| Strawberry | 38% | 44% | |||
| Cheese | 88% | 91% | |||
| Vanilla | 50% | 54% | |||
| Onion | 38% | 52% | |||
Statistically significant at p value ≤ 0.05
Statistically significant at p value ≤ 0.001
Same as odor for liquorice but correct answer was provided with different distractor items
Retronasal olfaction
Retronasal olfaction was tested using odorized powders presented to the oral cavity, as previously described.17,18 The retronasal test consisted of twenty grocery store condiments and food items that were available in powder form or odorized powders used in the food industry (Givaudan Flavors Corporation, IL, Chicago). The majority of items overlapped with those utilized in prior studies; however, given expected cross-cultural differences, several items were replaced with foods common to the southern United States (Table 5). These flavors were applied to the mid-posterior tongue using 50–90mg polystyrene mini scoops (Liftmode, Illinois, Chicago). Prior to application, patients pinched their nose, and were only allowed to unblock it after the powder was placed in the oral cavity and mouth closed. The mouth was kept closed until selection of the powder’s odor was done using a forced multiple-choice paradigm with three distractor items. Patients rinsed their mouths with tap water after identification of each odor. Total retronasal scores were obtained by adding the number of correct identifications. This ranged from 0–20.
Taste testing:
Taste testing was performed using validated taste strips (“Taste Strips”, Burghart, Wedel, Germany).19 Sixteen strips impregnated with four different concentrations of four tastants: sweet, sour, salty and bitter were assessed in comparison to a control. The following concentrations were used: sweet: 0.4, 0.2, 0.1, 0.05 g/ml sucrose; sour: 0.3, 0.165, 0.09, 0.05 g/ml citric acid; salty: 0.25, 0.1, 0.04, 0.016 g/ml sodium chloride; bitter: 0.006, 0.0024, 0.0009, 0.0004 g/ml quinine hydrochloride. Testing was performed from the lowest to highest concentrations in a pseudorandom fashion. The taste strips were placed in the anterior mid-tongue, and patients were allowed to close their mouth and move the strip around. Patients identified the tastes in a forced choice paradigm. Scores for each subgroup ranged from 0–4 with lower scores indicating worse performance. Subgroup scores were added to give the total taste score. Gustatory dysfunction was determined using ideal cut-offs previously reported by Mueller et al. based on a <= 10th percentile each of the four taste groups.19 A score of <2 was considered hypogeusia for the sweet, sour and salty taste subgroups and less than 1 for the bitter subgroup. An overall score of <9 was considered hypogeusia.19
Statistical analysis:
SPSS 24.0 (IBM Corporation, Armonk, NY) and SAS 9.4 (Cary, NC) were used for data analysis. Bivariate analysis between taste dysfunction and demographics and comorbidities was done using independent t-tests for continuous variables and chi-square or Fisher’s exact tests for categorical variables. Variables with p values of 0.2 or less were included in the forward selection process in order to determine a final regression model of correlates with taste dysfunction. Three goodness of fit tests on the final model were not significant (Hosmer–Lemeshow, p=0.957, Deviance, p=0.990, and Pearson, p=0.956), suggesting good model fit. Due to the small sample size, likelihood ratio (p<0.001), Score (p<0.001), and Wald (p=0.005) tests were also performed, the significance of which support the use of regular logistic regression over exact logistic regression used on small samples.20 Variance inflation factors were under 1.9 and condition numbers were under 8.8 for the duration of the forward selection process, appearing to indicate low collinearity. Orthonasal and retronasal identification was tested for differences in taste dysfunction categories using chi-square or Fisher’s exact tests. Apart from variable selection for regression p values of ≤ 0.05 were considered statistically significant.
Results:
Study Cohort Demographics
A total of 70 patients were enrolled with a mean age of 52 years (range 20–77). Just under half of the participants were female (46%) and approximately 23% were African American. Hyposmics and anosmics made up 43% and 30% of the study population, respectively, based on their composite TDI scores. A majority of the participants had CRSwNP (57%), which included 7% of our cohort with allergic fungal rhinosinusitis. Forty-three percent were diagnosed with CRSsNP.
Impaired Eating-Related QOL and Clinical Correlates
Approximately one quarter of the participants (23%) were determined to have impaired eating-related QOL (Table 1). Complete comparison of the demographics and CRS-related metrics between patients with and without impaired eating QOL is listed in Tables 2 and 3. Logistic regression was performed to detect correlates for impaired eating QOL. The reported odds ratio estimates as shown in Table 4 reflect testing variables with p<0.20 in the model during the forward selection process. This included threshold test score, identification test score, discrimination test score, endoscopic score, olfactory cleft endoscopic score, PHQ-9 score, SNOT-22 score, asthma, gender, nasal polyp status, retronasal test score, AERD, and race. After regression analysis diagnosis of AERD, PHQ-9 score, and olfactory threshold score remained statistically significant. Patients with a diagnosis of AERD were found to have 10.7 times higher odds of impaired eating-related QOL (OR =10.72, 95% CI: 1.09–105.09, p=0.042) after adjusting for PHQ-9 and threshold score. Meanwhile, for every 1 point of increase in PHQ-9 score, the odds of having impaired eating-related QOL increased by 1.3 (OR=1.31, 95% CI: 1.10–1.57, p=0.003) after adjusting for sex and threshold score. Finally, for every 1 point of decrease in olfactory threshold, the odds of having impaired eating-related QOL increased by 1.9 times (OR=1.85, 95% CI: 1.14–3.00, p=0.013) after adjusting for sex and PHQ-9.
Table 1.
Patient demographics stratified by QOD eating- and CCS taste-related responses. Shaded gray cells indicate impaired eating-related QOL.
| QOD eating-related responses† | Total | |||||||||||||
|---|---|---|---|---|---|---|---|---|---|---|---|---|---|---|
| 0 | 1 | 2 | 3 | 4 | 5 | 6 | 7 | 8 | 9 | 10 | ||||
| CCS taste-related responses† | 0 | 18 | 0 | 4 | 2 | 0 | 2 | 0 | 0 | 0 | 0 | 0 | 26 | Increased taste complaints ⇓ |
| 1 | 6 | 2 | 2 | 0 | 0 | 0 | 1 | 0 | 0 | 0 | 0 | 11 | ||
| 2 | 4 | 1 | 3 | 4 | 1 | 1 | 3 | 3 | 1 | 1 | 1 | 23 | ||
| 3 | 1 | 0 | 0 | 2 | 1 | 2 | 0 | 1 | 2 | 1 | 0 | 10 | ||
| Total | 29 | 3 | 9 | 8 | 2 | 5 | 4 | 4 | 3 | 2 | 1 | 70 | ||
| Increased eating complaints ⇒ | ||||||||||||||
QOD=Questionnaire for Olfactory Dysfunction, CCS=Chemosensory Complaint Score
Table 2.
Patient demographics stratified by impaired eating-related QOL
| Demographics and comorbidities | Normal Eating-related QOL (n=54) |
Impaired Eating-related QOL (n=16) |
p-value |
|---|---|---|---|
| Age, mean (SD) | 52.2 (17.1) | 51.1 (15.7) | p=0.821 |
| Female gender† | 39% | 69% | p=0.035 |
| Non-white race | 20% | 38% | p=0.191 |
| Hispanic/Latino race | 7% | 0% | p=0.567 |
| Years of education, mean (SD) | 15.0 (2.6) | 15.3 (2.2) | p=0.725 |
| Current smoker | 6% | 0% | p=1.000 |
| Drinks per week† | 5.0 (4.6) | 1.7 (2.5) | p=0.011 |
| Diabetes | 7.4% | 13% | p=0.614 |
| Asthma† | 35% | 69% | p=0.017 |
| Allergy by testing | 59% | 56% | p=0.830 |
| AERD† | 4% | 38% | p=0.001 |
| COPD | 2% | 0% | p=1.000 |
| GERD | 31% | 50% | p=0.175 |
| Migraines | 17% | 19% | p=1.000 |
| Fibromyalgia | 4% | 0% | p=1.000 |
| Depression (Medicated) | 9% | 19% | p=0.372 |
| Anxiety (Medicated) | 11% | 6% | p=1.000 |
| OSA | 13% | 25% | p=0.209 |
COPD= chronic obstructive pulmonary disease, GERD=gastroesophageal reflux disease, OSA= obstructive sleep apnea, AERD=aspirin exacerbated respiratory disease.
Statistically significant at p value ≤ 0.05
Table 3.
CRS-related metrics stratified by impaired eating-related QOL
| CRS-related metrics | Normal Eating-related QOL (n=54) |
Impaired Eating-related QOL (n=16) |
p-value |
|---|---|---|---|
| Nasal polyps† | 46% | 75% | p=0.043 |
| Previous sinus surgery | 89% | 81% | p=0.417 |
| Lund Kennedy† Endoscopic score† | 4.5 (3.5) | 8.0 (3.6) | p=0.001 |
| OC Endoscopy score† | 3.0 (3.3) | 7.1 (4.6) | p<0.001 |
| Patient-reported outcomes | |||
| SNOT22 † | 35.2 (22.6) | 55.6 (24.7) | p=0.003 |
| PHQ-9 † | 3.6 (3.9) | 8.4 (5.2) | p<0.001 |
| QOD NS† | 7.0 (7.0) | 25.1 (9.3) | p<0.001 |
| CCS Smell Score† | 2.3 (2.0) | 4.4 (0.9) | p<0.001 |
| CCS Total Score† | 4.7 (4.0) | 10.5 (2.6) | p<0.001 |
| Objective olfaction and gustation | |||
| Threshold † | 4.6 (3.1) | 1.6 (1.0) | p<0.001 |
| Discrimination † | 9.9 (2.8) | 6.8 (3.1) | p<0.001 |
| Identification† | 10.9 (3.7) | 6.7 (3.9) | p<0.001 |
| TDI † | 25.4 (8.5) | 15.1 (6.4) | p<0.001 |
| Retronasal olfaction score† | 12.0 (4.3) | 9.6 (3.0) | p=0.039 |
| Taste score | 10.5 (2.7) | 9.9 (2.7) | p=0.463 |
OC= olfactory cleft, TDI= threshold, discrimination, identification, QOD=Questionnaire for Olfactory Dysfunction, CCS=Chemosensory Complaint Score, SD= standard deviation.
All values other than percentages are mean (SD).
Statistically significant at p value ≤ 0.05
Table 4.
Odds ratio estimates for impaired eating-related QOL in CRS population
| Effect | Odds Ratio | 95% Wald CI limits | Significance |
|---|---|---|---|
| Threshold† | 1.851 | 1.14–3.00 | p=0.013 |
| PHQ-9 score† | 1.313 | 1.10–1.57 | p=0.007 |
| AERD† | 10.72 | 1.09–105.09 | p=0.042 |
CRS = chronic rhinosinusitis, AERD=aspirin exacerbated respiratory disease, CI=confidence interval.
Statistically significant at p value ≤ 0.05
Within the PHQ-9 questionnaire, one question specifically inquires about “poor appetite or overeating?”. In order to ensure that the above associations did not result directly from this question, the remaining 8 questions of the PHQ-9 were used as a modified PHQ-9 score. These results remained significant, but are not included in this report in order to use a validated measure more easily recognizable and understood by the rhinologic community.
Impaired Eating-Related QOL correlation with Individual Orthonasal and Retronasal Odors
Impaired eating-related QOL correlated with several individual odors on both orthonasal and retronasal function. Orthonasal odors found to differ were anise (same odor as liquorice), peppermint, orange, garlic, fish, clove and leather (p<0.05) as shown in Table 5. Statistical significance was also demonstrated with several retronasal odors including bread, banana and grape (p<0.05) (Table 5).
Discussion
Smell and taste are integral components to eating, which in itself is not only a necessity for survival, but profoundly intertwined with interpersonal relationships and social well-being.1 Given that a large proportion of patients with CRS, if not the majority, have disturbances in objective measures of smell, taste or both senses7,9, it is not surprising that a significant portion of the CRS population have eating-related complaints. However, objective measures of smell and taste fail to completely explain these disturbances in CRS patients’ QOL.3,4,6,7 In an effort to better understand the associations behind these QOL dysfunctions, we examined a cohort of CRS patients. We found that nearly a quarter of CRS patients in this cohort reported impaired eating-related QOL. This study demonstrates increased odds of eating-related QOL dysfunction in CRS patients with a comorbid diagnosis of AERD, as well as patients with higher depression scores. Furthermore, orthonasal threshold scores had an inverse correlation with eating-related dysfunction, suggesting that the ability to detect odors at lower concentrations is associated with better eating-related QOL.
AERD appears to be an important determinant in both olfactory dysfunction and impaired eating-related QOL. In a study of 190 AERD patients, 89% of AERD patients self-reported smell loss. Of the potential effects of their decreased olfaction on QOL, the enjoyment of food and eating was missed the most, even beyond the feelings of safety or as a trigger for pleasant memories.21 Patients with AERD have been found to have significantly worse threshold and identification scores, as well as retronasal olfaction, compared to their aspirin tolerant counterparts.6,22 Though the mechanism of eating-related QOL reduction in AERD patients is beyond the scope of this investigation, we found that orthonasal identification and retronasal olfaction failed to correlate with eating-related QOL after controlling for other variables. Similarly, nasal polyps and asthma as independent variables failed to correlate. Thus, it may be that AERD represents a unique condition that impacts eating-related QOL via unknown mechanisms. Regarding treatment of this difficult subset of patients, it is notable that the investigation by Gudziol et al. demonstrated normalization of olfaction to that of the level of non-AERD CRS patients as well as improvement of sinonasal symptoms (SNOT-22 scores) following aspirin desensitization.22 Additionally, several reports have demonstrated improved QOL in AERD patients following aspirin desensitization, suggesting that this therapy could also potentially impact eating-related QOL.23–25
Beyond the comorbid diagnosis of AERD, there also appears to be an association of depression with eating-related QOL. This is not altogether surprising as the relationship between olfaction and depression has been well studied,26–28 and to a lesser extent, there is a smaller body of literature demonstrating the relationship between taste and depression.29 The mechanism between depression and chemosensory dysfunction, however, is unknown. Given the integral nature of chemosensory function for both intra- and interpersonal relationships and pleasure, it is logical that dysfunction in either aspect would influence the other.2 Certainly, the inability to enjoy food from changes in smell or taste could lead to depression and decreased QOL, however, the inherent QOL disruptions stemming from depression could lead to similar complaints.
In addition to patient demographics, this study demonstrates the association between objective smell testing and eating-related QOL. While both orthonasal and retronasal testing demonstrated differences in patients with eating-related dysfunction, regression modeling revealed an inverse relationship between the threshold score of orthonasal testing and eating-related QOL. These findings did not hold true for retronasal testing, which is typically thought to be a critical component to the experience of food. This suggests that the ability to smell and perceive food, even before it is consumed, may be particularly important to our experience and enjoyment of food. That is to say, the anticipatory stage of a meal, that is either being prepared or placed before you, may play a critical role in eating-related QOL.
Although this study demonstrated differences in perception of individual odors both orthonasally and retronasally in patients with and without impaired eating-related QOL, this study was unable to identify one particular odor or set of odors that may be a driving force behind this dysfunction. Nevertheless, at an individual level, there were differences in individual odors that are standard ingredients in the typical American diet such as bread, banana, liquorice, fish, garlic and peppermint. The combination of a small sample size and the limited statistical power of this study may have led to the inability to detect differences in some of these variables where a statistically significant or clinically important difference may exist. Future studies should aim to identify individual odors and tastes thereby enabling clinicians and patients alike to modify diets with a goal of improving patient QOL. Furthermore, while the cross-sectional nature of this study does lend itself to generalizability of the CRS population as a whole, we are unable assess the influence of treatments or exacerbations on eating-related QOL.
In line with the small sample size and lack of statistical power, the variables in this study that were not significant correlates with the eating-related QOL should not necessarily be discounted as noncontributory. For instance, SNOT-22 scores between the two groups did not remain statistically significant following regression modeling likely as both a factor of the statistical power in this study and the fact that the SNOT-22 was not designed to directly measure eating-related quality of life. Rather, associations found to be significant in this analysis (AERD, depression and threshold scores) may be considered very strong correlates for this type of QOL disruption, which made them easier to detect with a small sample using logistic regression.
Additionally, our study was limited to measures of olfaction and gustation. Other sensory functions, including trigeminal and visual input, play an important role in eating and remain areas for further study. The lack of a validated instrument to assess patients’ enjoyment of eating or food, resulted in our selection of QOD eating-related and CCS taste-related questions as a proxy for eating-related quality of life. As such, in this study, eating-related quality of life is a metric derived by reasoning and the tools available rather a validated and broadly applicable instrument. This study provides impetus for the creation of validated instruments designed to specifically explore how patients experience and enjoy food, in order to elucidate the factors that influence it. Finally, the characteristics of this study population may limit generalizability of the observed findings. The participants included were recruited from tertiary rhinology clinics with a high burden of disease and incidence of prior surgery.
Conclusion
Disruptions in eating-related quality of life cannot be fully explained by objective smell or taste testing alone. We identified a comorbid diagnosis of AERD and depression as independent risk factors for greater odds of impaired eating-related QOL in CRS. Improved orthonasal threshold scores were also independently associated with better eating-related QOL. Several orthonasal and retronasal odors did correlate with patient reported QOL disruptions, but none remained significant in multivariable regression. This should be an area of focus for future diagnostic and treatment-related studies.
Acknowledgments
Funding: This work was supported by a grant from the National Institute on Deafness and Other Communication Disorders (NIDCD), one of the National Institutes of Health, Bethesda, MD (3R01 DC005805). Public clinical trial registration (www.clinicaltrials.gov) ID# NCT02720653.
Footnotes
Conflict of interest: ZMS is a consultant for Olympus and 480 Biomedical as well as on the advisory board for Regeneron. RJS is consultant for Olympus and Arrinex and has received grant support from Entellus and Intersect. There are no other financial disclosures or conflicts of interest for any other author.
Presentation: This manuscript will be presented as an oral presentation at the 2018 American Rhinologic Society Annual Meeting held in Atlanta Georgia on October 6, 2018.
References:
- 1.Hamburg ME, Finkenauer C, Schuengel C. Food for love: the role of food offering in empathic emotion regulation. Frontiers in psychology 2014;5:32. [DOI] [PMC free article] [PubMed] [Google Scholar]
- 2.Merkonidis C, Grosse F, Ninh T, Hummel C, Haehner A, Hummel T. Characteristics of chemosensory disorders--results from a survey. European archives of oto-rhino-laryngology : official journal of the European Federation of Oto-Rhino-Laryngological Societies (EUFOS) : affiliated with the German Society for Oto-Rhino-Laryngology - Head and Neck Surgery 2015;272:1403–16. [DOI] [PubMed] [Google Scholar]
- 3.Soler ZM, Smith TL, Alt JA, Ramakrishnan VR, Mace JC, Schlosser RJ. Olfactory-specific quality of life outcomes after endoscopic sinus surgery. International forum of allergy & rhinology 2016;6:407–13. [DOI] [PMC free article] [PubMed] [Google Scholar]
- 4.Mattos JL, Schlosser RJ, Storck KA, Soler ZM. Understanding the relationship between olfactory-specific quality of life, objective olfactory loss, and patient factors in chronic rhinosinusitis. International forum of allergy & rhinology 2017;7:734–40. [DOI] [PMC free article] [PubMed] [Google Scholar]
- 5.Mattos JL, Schlosser RJ, DeConde AS, et al. Factor analysis of the questionnaire of olfactory disorders in patients with chronic rhinosinusitis. International forum of allergy & rhinology 2018. [DOI] [PMC free article] [PubMed]
- 6.Othieno F, Schlosser RJ, Storck KA, Rowan NR, Smith TL, Soler ZM. Retronasal olfaction in chronic rhinosinusitis. The Laryngoscope 2018. [DOI] [PMC free article] [PubMed]
- 7.Othieno F, Schlosser RJ, Rowan NR, et al. Taste impairment in chronic rhinosinusitis. International forum of allergy & rhinology 2018. [DOI] [PMC free article] [PubMed]
- 8.Schlosser RJ, Storck KA, Rudmik L, et al. Association of olfactory dysfunction in chronic rhinosinusitis with economic productivity and medication usage. International forum of allergy & rhinology 2017;7:50–5. [DOI] [PMC free article] [PubMed] [Google Scholar]
- 9.Litvack JR, Mace JC, Smith TL. Olfactory function and disease severity in chronic rhinosinusitis. American journal of rhinology & allergy 2009;23:139–44. [DOI] [PMC free article] [PubMed] [Google Scholar]
- 10.Rosenfeld RM, Piccirillo JF, Chandrasekhar SS, et al. Clinical practice guideline (update): adult sinusitis. Otolaryngology--head and neck surgery : official journal of American Academy of Otolaryngology-Head and Neck Surgery 2015;152:S1–s39. [DOI] [PubMed] [Google Scholar]
- 11.Heald AE, Pieper CF, Schiffman SS. Taste and smell complaints in HIV-infected patients. AIDS (London, England) 1998;12:1667–74. [DOI] [PubMed] [Google Scholar]
- 12.Lund VJ, Kennedy DW. Quantification for staging sinusitis. The Staging and Therapy Group. The Annals of otology, rhinology & laryngology Supplement 1995;167:17–21. [PubMed] [Google Scholar]
- 13.Soler ZM, Hyer JM, Karnezis TT, Schlosser RJ. The Olfactory Cleft Endoscopy Scale correlates with olfactory metrics in patients with chronic rhinosinusitis. International forum of allergy & rhinology 2016;6:293–8. [DOI] [PMC free article] [PubMed] [Google Scholar]
- 14.Morley AD, Sharp HR. A review of sinonasal outcome scoring systems - which is best? Clinical otolaryngology : official journal of ENT-UK ; official journal of Netherlands Society for Oto-Rhino-Laryngology & Cervico-Facial Surgery 2006;31:103–9. [DOI] [PubMed] [Google Scholar]
- 15.Kroenke K, Spitzer RL, Williams JB. The Patient Health Questionnaire-2: validity of a two-item depression screener. Medical care 2003;41:1284–92. [DOI] [PubMed] [Google Scholar]
- 16.Hummel T, Erras A, Kobal G. A test for the screening of taste function. Rhinology 1997;35:146–8. [PubMed] [Google Scholar]
- 17.Landis BN, Giger R, Ricchetti A, et al. Retronasal olfactory function in nasal polyposis. The Laryngoscope 2003;113:1993–7. [DOI] [PubMed] [Google Scholar]
- 18.Heilmann S, Strehle G, Rosenheim K, Damm M, Hummel T. Clinical assessment of retronasal olfactory function. Archives of otolaryngology--head & neck surgery 2002;128:414–8. [DOI] [PubMed] [Google Scholar]
- 19.Mueller C, Kallert S, Renner B, et al. Quantitative assessment of gustatory function in a clinical context using impregnated “taste strips”. Rhinology 2003;41:2–6. [PubMed] [Google Scholar]
- 20.Derr RE. Performing Exact Logistic Regression with the SAS2009
- 21.Ta V, White AA. Survey-Defined Patient Experiences With Aspirin-Exacerbated Respiratory Disease. The journal of allergy and clinical immunology In practice 2015;3:711–8. [DOI] [PubMed] [Google Scholar]
- 22.Gudziol V, Michel M, Sonnefeld C, Koschel D, Hummel T. Olfaction and sinonasal symptoms in patients with CRSwNP and AERD and without AERD: a cross-sectional and longitudinal study. European archives of oto-rhino-laryngology : official journal of the European Federation of Oto-Rhino-Laryngological Societies (EUFOS) : affiliated with the German Society for Oto-Rhino-Laryngology - Head and Neck Surgery 2017;274:1487–93. [DOI] [PubMed] [Google Scholar]
- 23.Walters KM, Waldram JD, Woessner KM, White AA. Long-term Clinical Outcomes of Aspirin Desensitization With Continuous Daily Aspirin Therapy in Aspirin-exacerbated Respiratory Disease. American journal of rhinology & allergy 2018;32:280–6. [DOI] [PubMed] [Google Scholar]
- 24.Ibrahim C, Singh K, Tsai G, et al. A retrospective study of the clinical benefit from acetylsalicylic acid desensitization in patients with nasal polyposis and asthma. Allergy, asthma, and clinical immunology : official journal of the Canadian Society of Allergy and Clinical Immunology 2014;10:64. [DOI] [PMC free article] [PubMed] [Google Scholar]
- 25.Fruth K, Pogorzelski B, Schmidtmann I, et al. Low-dose aspirin desensitization in individuals with aspirin-exacerbated respiratory disease. Allergy 2013;68:659–65. [DOI] [PubMed] [Google Scholar]
- 26.Rochet M, El-Hage W, Richa S, Kazour F, Atanasova B. Depression, Olfaction, and Quality of Life: A Mutual Relationship. Brain sciences 2018;8. [DOI] [PMC free article] [PubMed] [Google Scholar]
- 27.Hur K, Choi JS, Zheng M, Shen J, Wrobel B. Association of alterations in smell and taste with depression in older adults. Laryngoscope investigative otolaryngology 2018;3:94–9. [DOI] [PMC free article] [PubMed] [Google Scholar]
- 28.Kohli P, Soler ZM, Nguyen SA, Muus JS, Schlosser RJ. The Association Between Olfaction and Depression: A Systematic Review. Chemical senses 2016;41:479–86. [DOI] [PMC free article] [PubMed] [Google Scholar]
- 29.Heath TP, Melichar JK, Nutt DJ, Donaldson LF. Human taste thresholds are modulated by serotonin and noradrenaline. The Journal of neuroscience : the official journal of the Society for Neuroscience 2006;26:12664–71. [DOI] [PMC free article] [PubMed] [Google Scholar]