
Figure 5: DMT1 levels and distribution in the sciatic nerve.
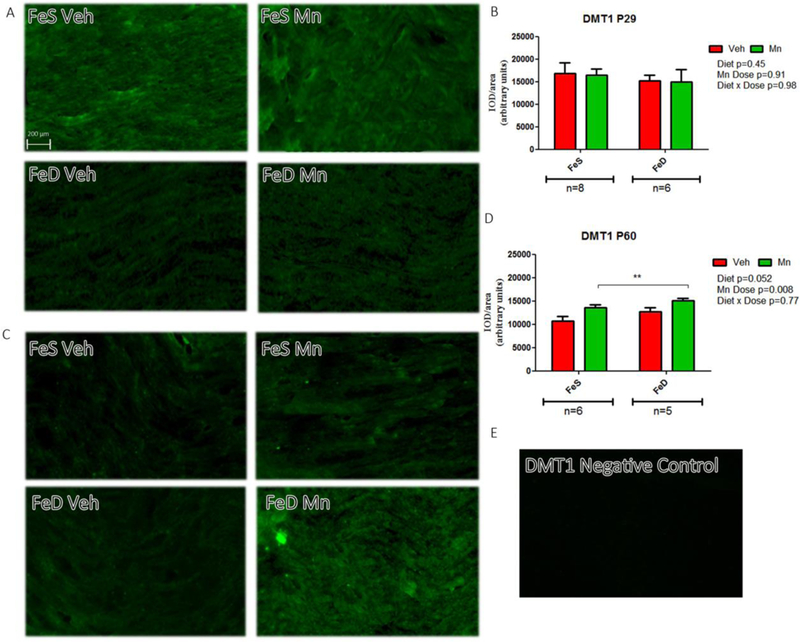
A, DMT1 immunofluorescence in sciatic nerve slices from P29 in the FeS (n=8) and FeD (n=6) groups. C, DMT1 immunofluorescence in sciatic nerve slices from P60 rats in the FeS (n=6) and FeD (n=5) groups in each experimental condition. B, D: IOD quantification for DMT1. Values are expressed as the mean ± SEM in arbitrary units. Statistical analysis was performed through two-way ANOVA followed by Bonferroni post-test (*p < 0.05). E: Negative control staining for DMT1.