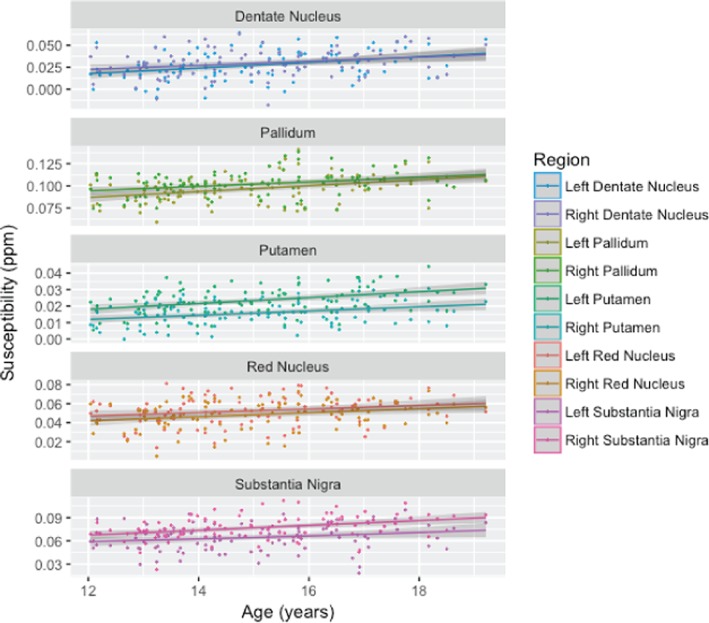
Figure 5.

Susceptibility signal plotted against age for the investigated regions on the left and right sides. All ROIs exhibit a significant age‐related increase in susceptibility, which is consistent with both edwR2 and eR2* [Color figure can be viewed at http://wileyonlinelibrary.com]
