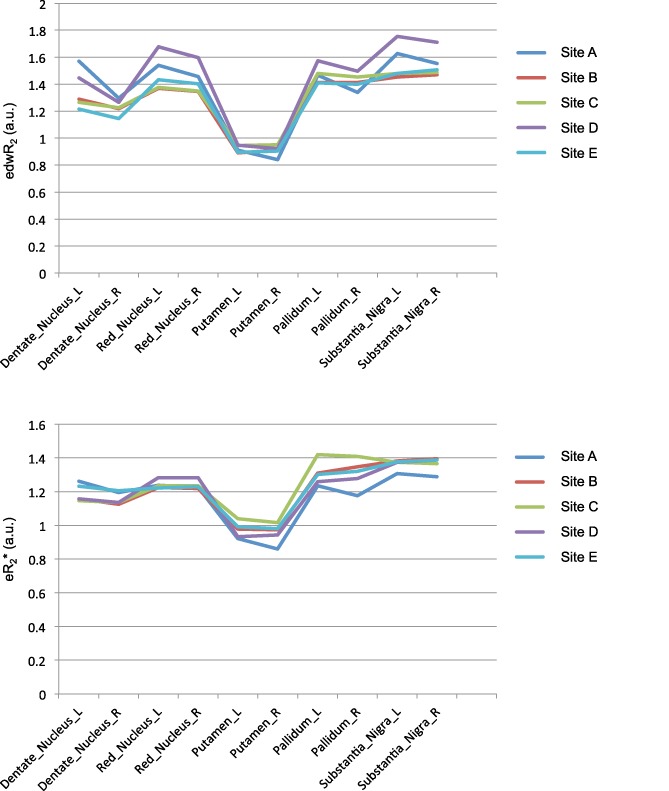
Figure 10.

Profiles of DTI edwR2 (top) and fMRI eR2* (bottom) iron estimates for the five ROIs by the five collection sites. The figures show that the two profiles by sites are highly similar as supported by the lack of interactions involving site [Color figure can be viewed at http://wileyonlinelibrary.com]
