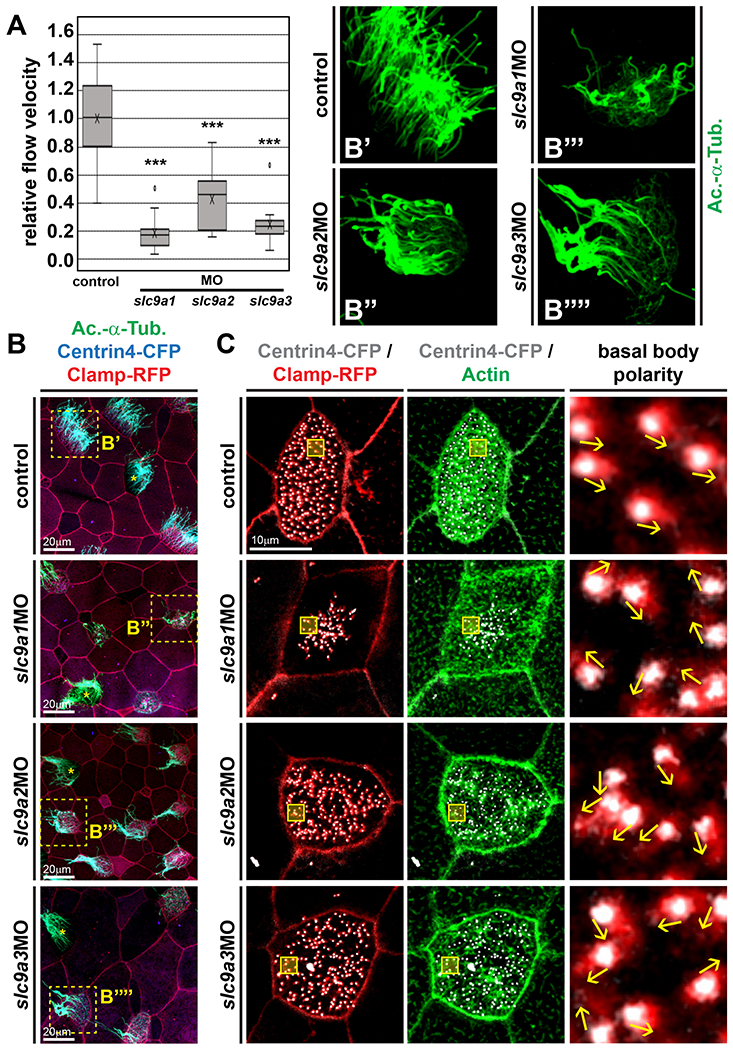
Figure 2: NHE1-3 Ioss-of-function impairs fluid flow, MCC cilia formation and basal body alignment.

(A) Extracellular fluid flow was quantified by addition of fluorescent beads to the medium and high-speed fluorescent microscopy for at least 10s at 50 – 100 frames per second. Uninjected embryos were used as controls (n = 15). Morphants were injected with the indicated MO (6 pmol). slc9a1MO, n = 13; slc9a2MO, n = 16; slc9a3MO, n = 14. Flow velocities were calculated relative to median values of uninjected controls. Boxes depict 50% of values, the median is depicted by the horizontal line, the mean is depicted by the cross. Whiskers indicate the upper and lower quartiles, outliers are depicted as circles. *** = P<0.001, Mann-Whitney test. (B) Embryos were injected with centrin4-cfp (blue) and clamp-rfp (red) mRNAs (control) to visualize cell borders and to identify targeted cells. Morphants were co-injected with 6 pmol of the indicted MO. Cilia were visualized by immunofluorescence staining against acetylated-α-tubulin (Ac.-α-Tub., green). Dashed boxes in micrographs on the left indicate magnified areas shown in B’-B’”. Non-targeted MCCs are indicated by asterisks. (C) Embryos were injected with centrin4-cfp (grey) and clamp-rfp (red) mRNAs (control) to visualize basal bodies and rootlets, respectively. Morphants were co-injected with 6 pmol of the indicted MO. F-actin was visualized by fluorescence staining with phalloidin (green). Boxes in micrographs on the left indicate magnified areas shown in the right panels. Direction of basal bodies is indicated by arrows. Scale bars indicate magnification.
