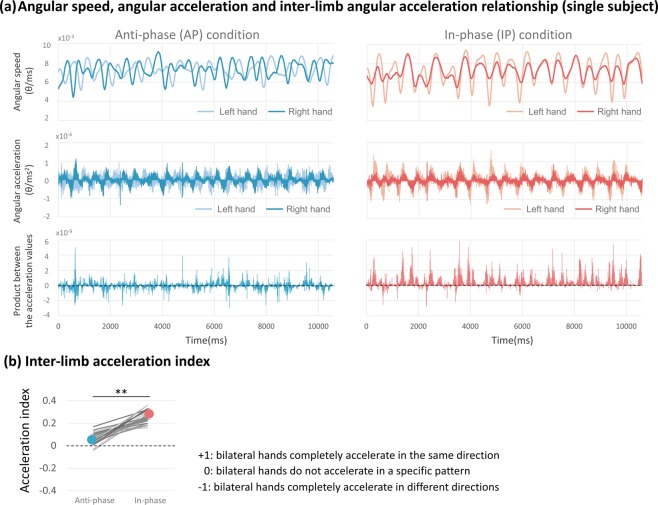
Figure 8.
Inter-limb acceleration index. (a) An example of angular speed and acceleration fluctuation within the trial (same subject, same trial as Fig. 7). The first row showed the time-series angular speed data from both hands. The speed changes of both hands are more convergent during in-phase movements, while in anti-phase movements the pattern is random. The second row showed the differentiation of the angular speed, i.e., angular acceleration of both hands. The third row showed the product between the time series acceleration values from left and right hands. (b) Individual and averaged inter-limb acceleration index during anti-phase movements and in-phase condition. **p < 0.001.

