Figure 4.
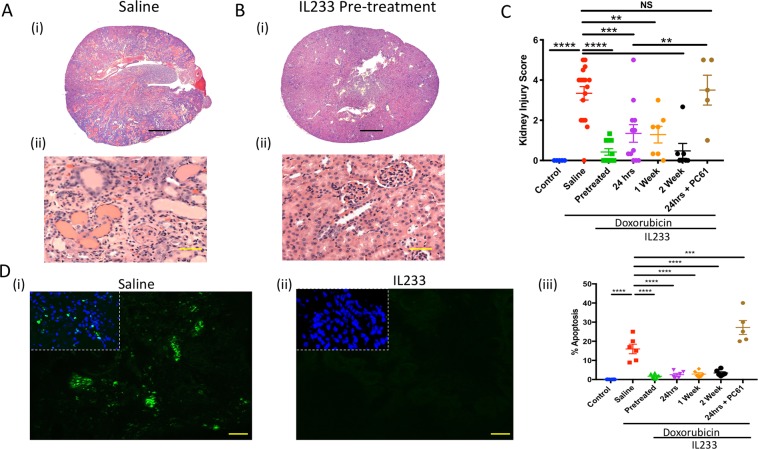
Renal injury was significantly lower upon IL233 treatment. (A) Representative hematoxylin and eosin stained sections (A, iii) Saline, (B, i-ii) IL233 Pre-treatment, Scale bars 300 μm (A-i and B-i), 50 μm (A-ii and B-ii); (C) Kidney injury score; (D) Representative images for TUNEL assay to analyze apoptosis, (i) Saline, (ii) pre-treatment, (iii) Enumeration of % apoptotic cells per high-power field. Symbols represent individual mice; mean ± SEM is shown. **p < 0.01; ***p < 0.001; ****p < 0.0001; NS p > 0.05 by one-way ANOVA.

