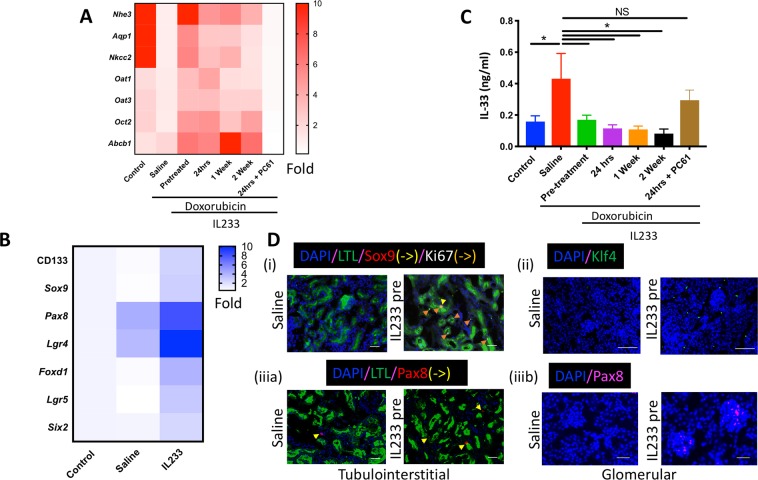
Figure 7.
IL233 treatment results in higher transporter and progenitor gene expression in kidneys. Real time PCR analysis of (A) renal transporter gene; (B) kidney progenitor genes (also see Supplementary Fig. 2); (C) levels of alarmin cytokine – IL-33. (D) Immunostaining of Saline/IL233-Pre (i) LTL/Sox9/ki67, (ii) Klf4, (iii) LTL/Pax8; Scale: 100 μm. N ≥ 6 except n = 4 for control in panel C, day 28; mean ± SEM is shown. *p < 0.05; NS p > 0.05 by one-way ANOVA.

