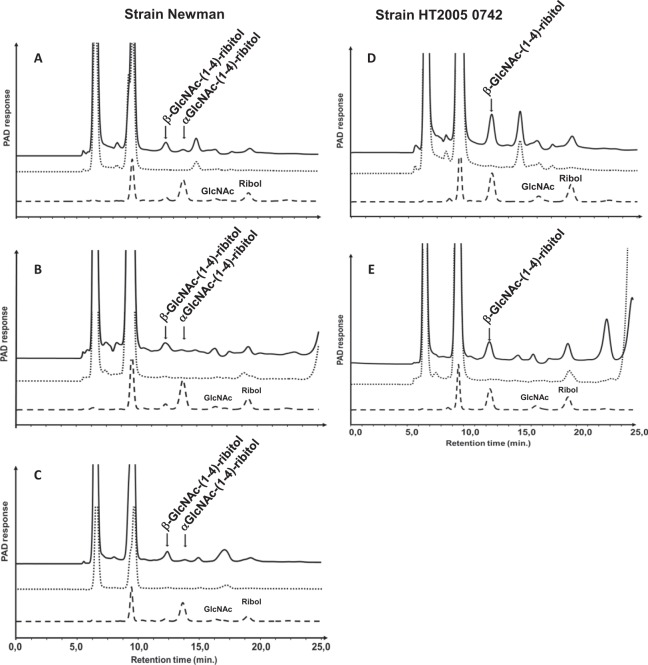
Figure 4.
HPAEC-PAD analyses of WTA from infected mouse organs: kidneys (A,D), livers (B,E), and muscles (C). Chromatograms of GlcNAc-ribitol disaccharides obtained from mouse infected (solid line) with the S. aureus Newman (A–C) and HT2005 742 (D,E) strains compared to chromatograms of disaccharides obtained from the strains grown in TSB and used for mouse infection (dashed line). Samples from kidney of naïve mice were analyzed in parallel as negative reference (dotted line).

